Application Performance Monitoring (APM) systems are software tools that allow you to set up your sites and applications for enhanced observability. In practice, this means that you can capture lots of rich, in-depth information about how your site is performing, from stack traces to database and external service calls. Anything that contributes to your site’s performance can be captured and analyzed. New Relic is one such APM tool that can give you insights into the performance of your WordPress website. Using tools like this is helpful because your website performance is not static in that your site can perform ideally one day and then seemingly suffer from degraded performance for no apparent reason the next. To debug these issues and restore the excellent experience your users expect, you need access to tools and data for comparison, visualization, and analysis.
This kind of performance debugging can get quite technical and might not be suitable for all site owners. However, if you are a technical site maintainer or owner and want to diagnose and debug performance issues, APM tools like New Relic might be just what you need.
In this tutorial, you’ll learn how to get started with New Relic on a WordPress website. You’ll find out how to set it up and discover key features on offer. Finally, you’ll see how New Relic can be used to debug performance issues using some examples.
Table of Contents
What is New Relic?
New Relic is a platform that allows you to monitor the entire stack of your web site or web-based application. In the case of WordPress sites, this includes PHP, the database, and the Redis cache, if you have one. Essentially, New Relic captures as much data as possible on each request on your WordPress site. This gives you a holistic view of how much time was spent in each stage of the stack for any given request, allowing you to easily debug performance issues, whether the root cause is in the database, themes, plugins, or something else.
While New Relic is a flexible tool that monitors many applications, including general PHP applications and sites, it does have a WordPress-specific configuration that streamlines the process of getting high-quality observability for your WordPress site. This configuration includes a pre-made New Relic dashboard and a set of alerts for key metrics. New Relic also has specific Application Performance Monitoring (APM) functionality for WordPress that allows you to see essential information about how your hooks, plugins, and themes are affecting your site’s performance.
Getting Started with New Relic
Before getting started, there are two things you need:
- A New Relic account, which you can create for free.
- A WordPress site where you have sudo CLI access and meet New Relic’s requirements. Note that shared hosting is generally not supported. This makes New Relic APM monitoring a great match for SpinupWP, as you have all the access needed to get it up and running.
Once you have both of these, you can start setting up New Relic. Go to the WordPress Instant Observability page, and you’ll be greeted with a prompt to install the default configuration.
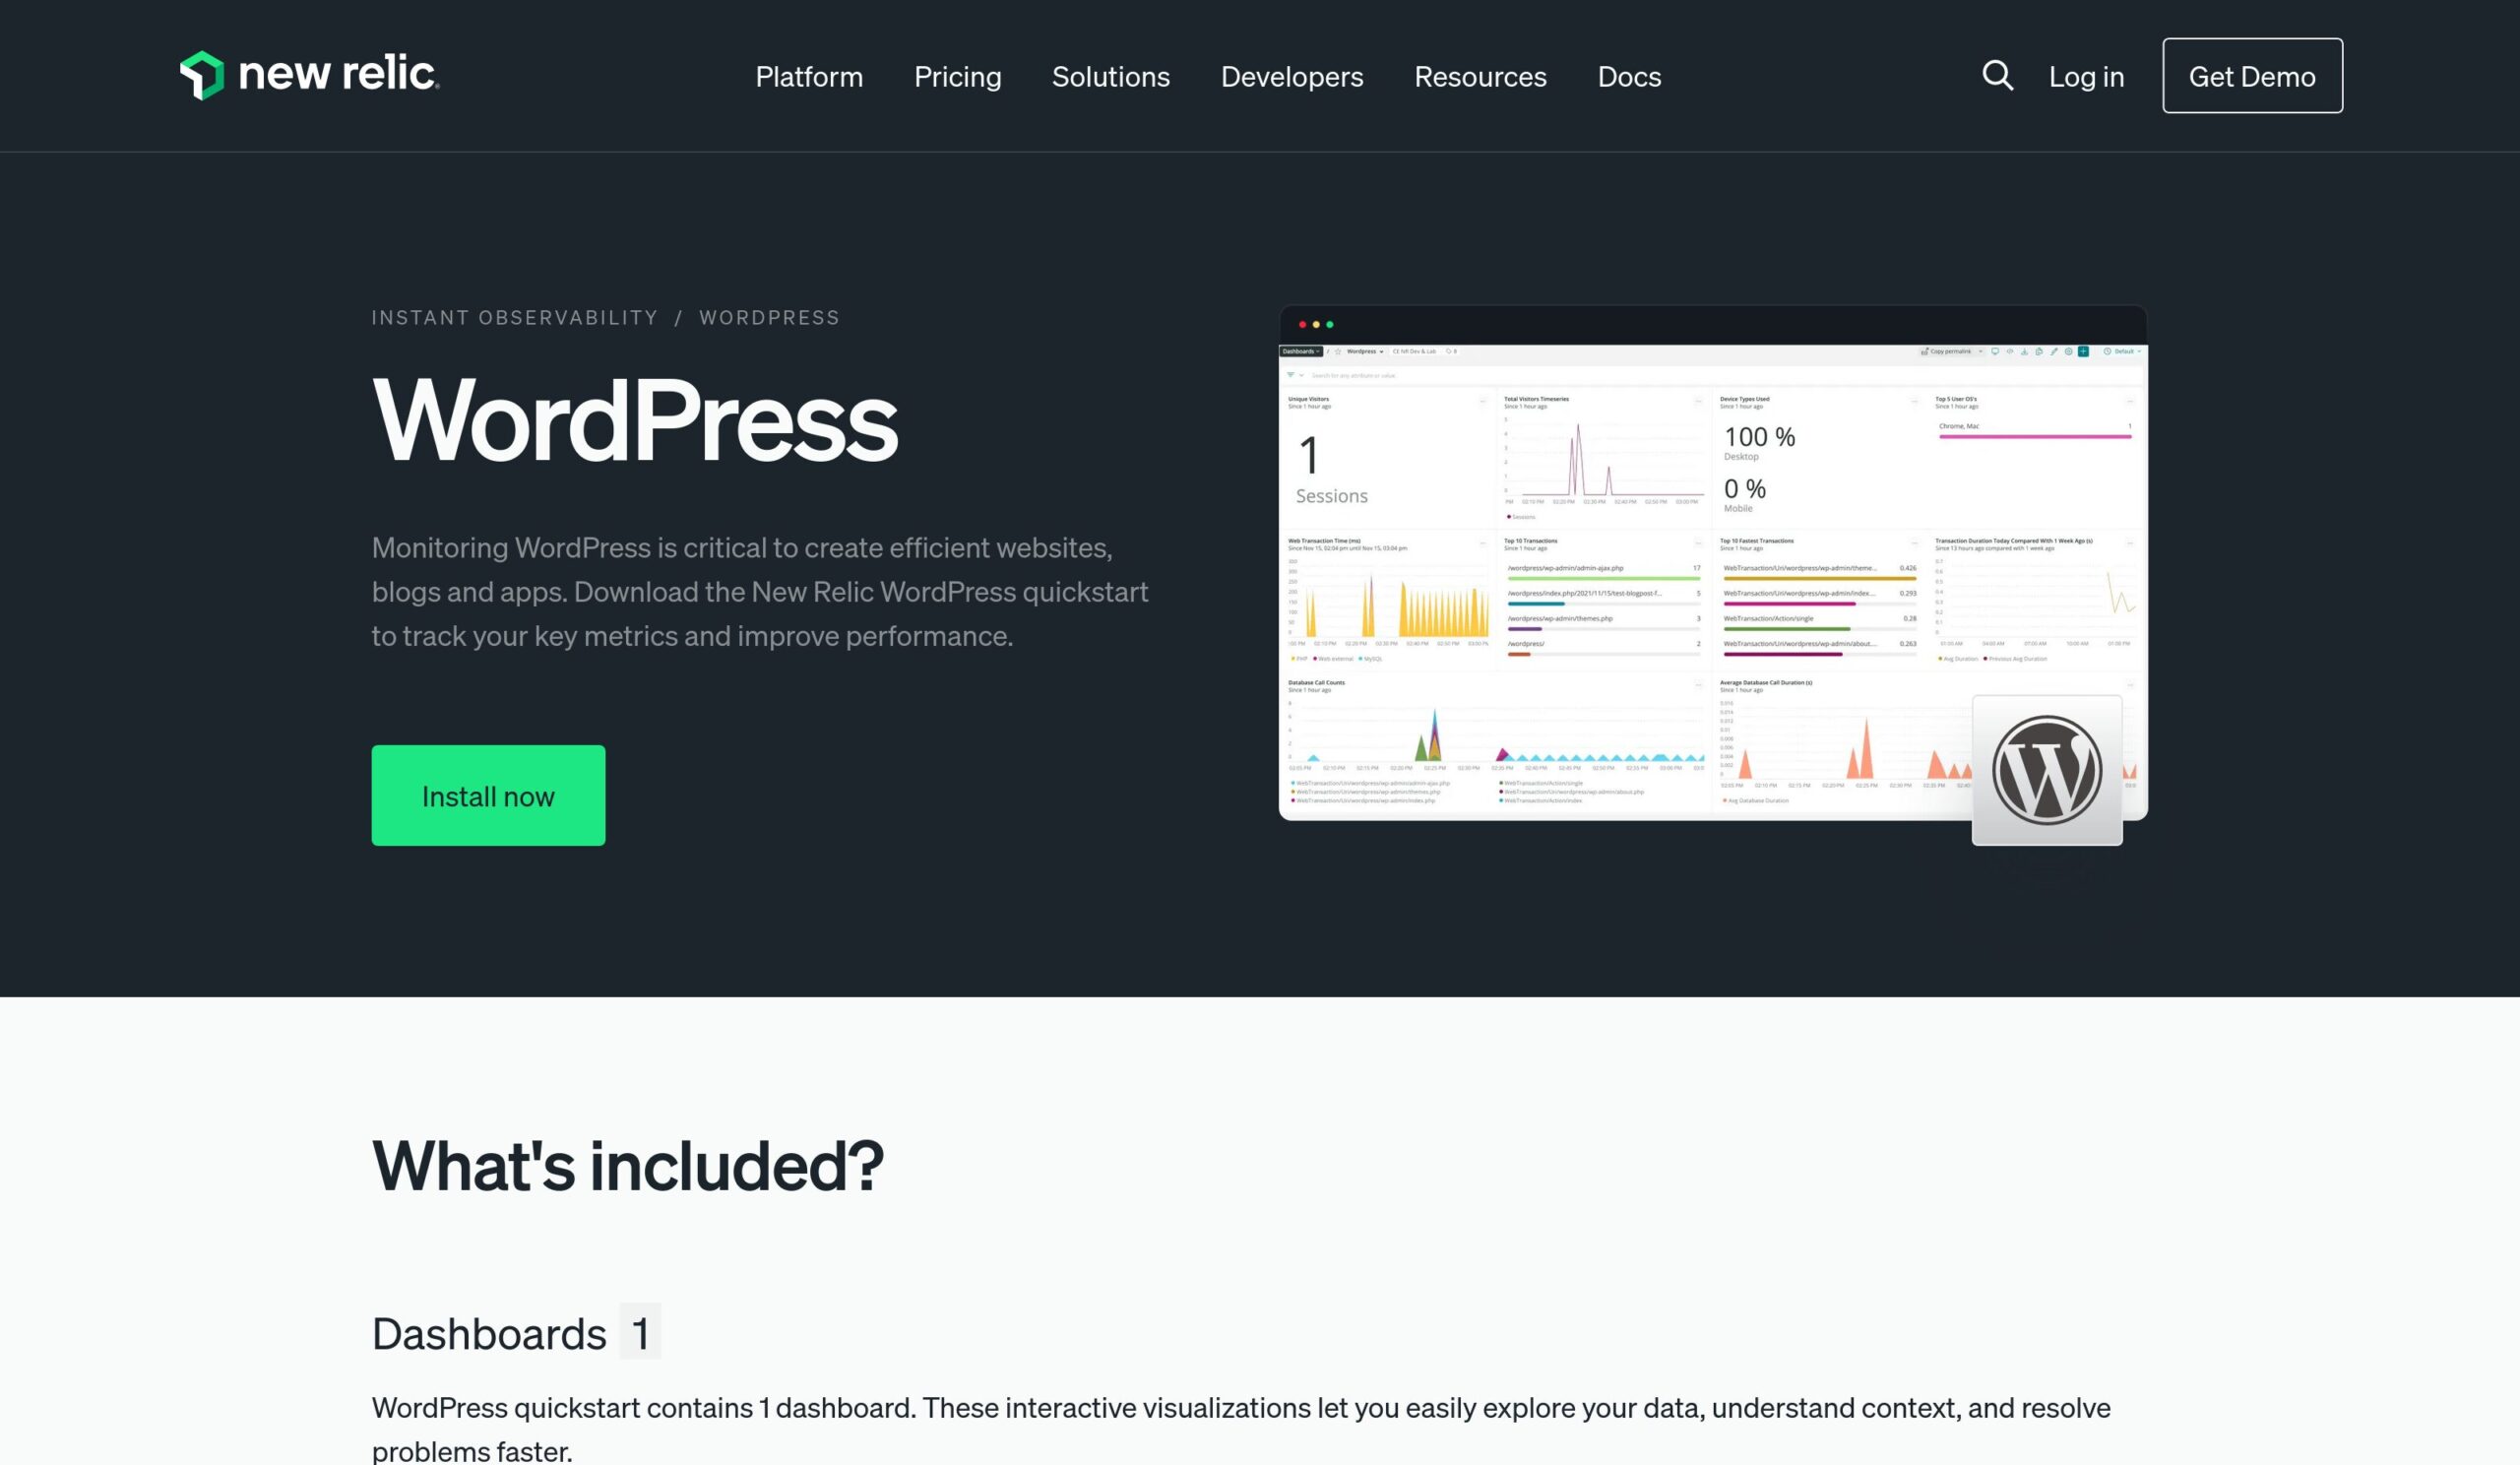
Select Install now, and you’ll be taken to a screen outlining what is going to be installed for your New Relic account, specifically, the dashboard, alerts, and data source:
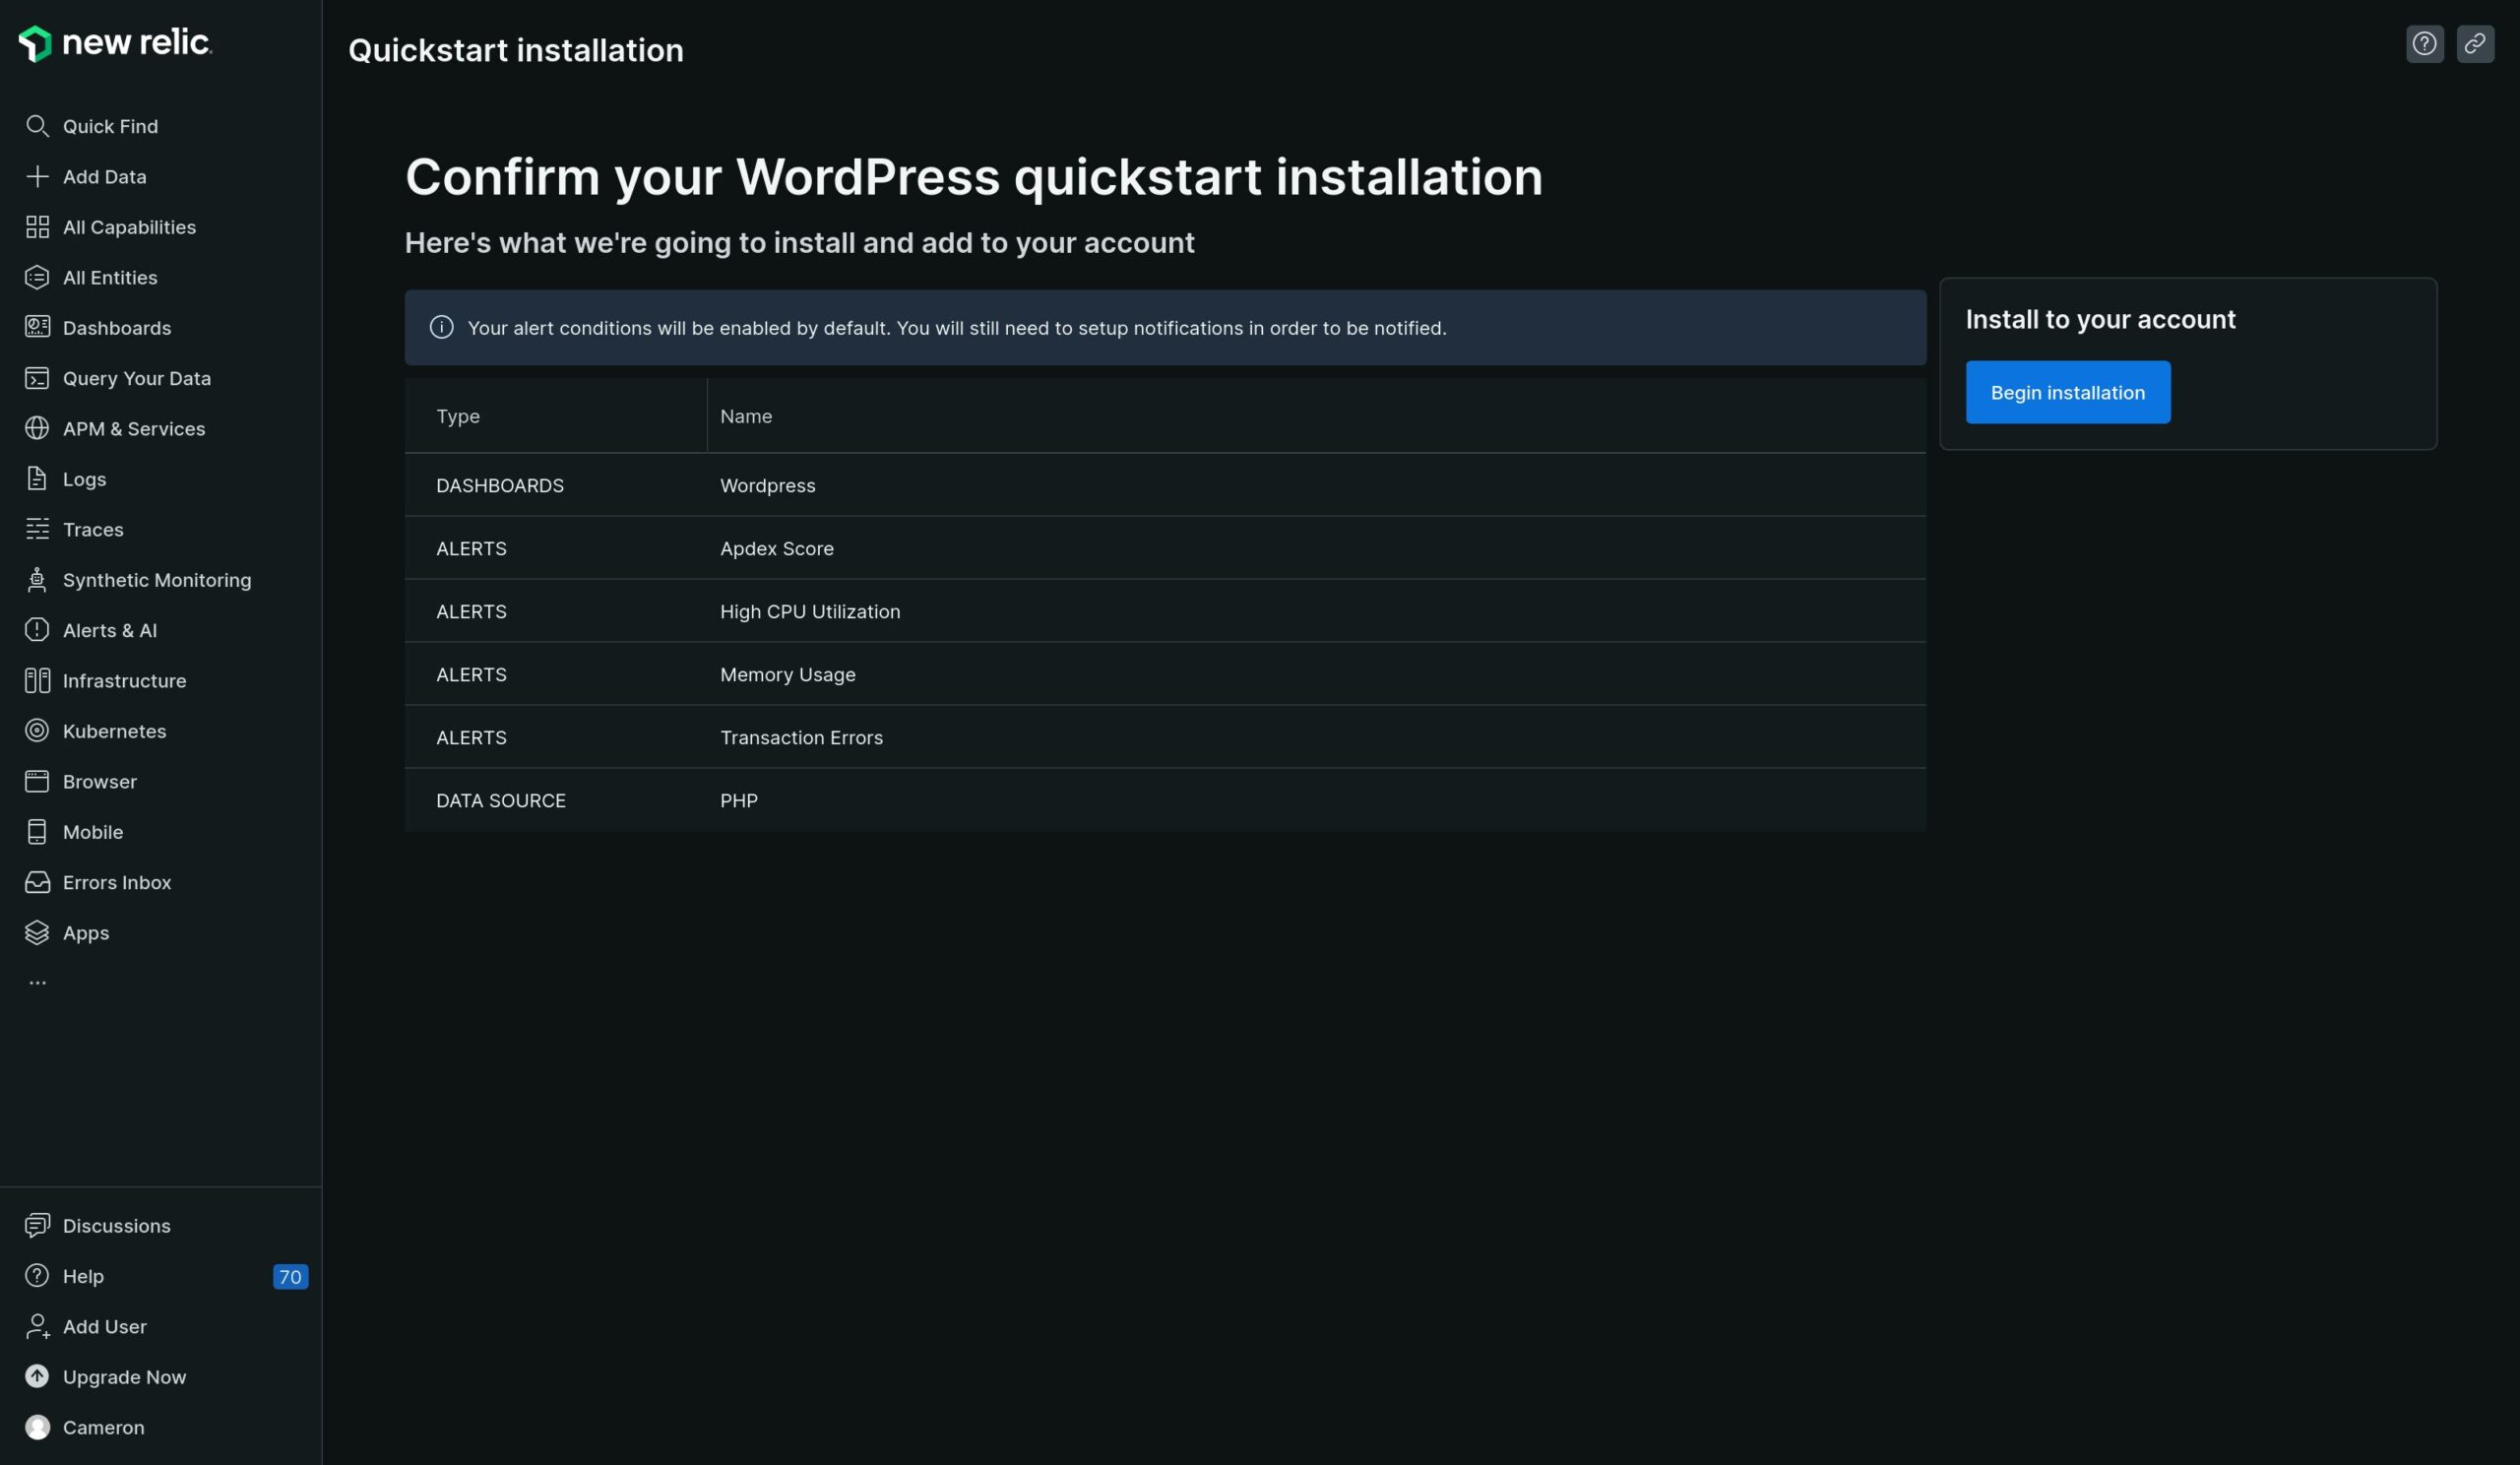
Click Begin installation and follow the prompts until you reach the PHP data source screen. Here, you will be presented with several methods for PHP. The correct one to pick will depend on the specifics of how your site is set up, but for most Virtual Private Server (VPS) installations, you can select On a host (CLI):
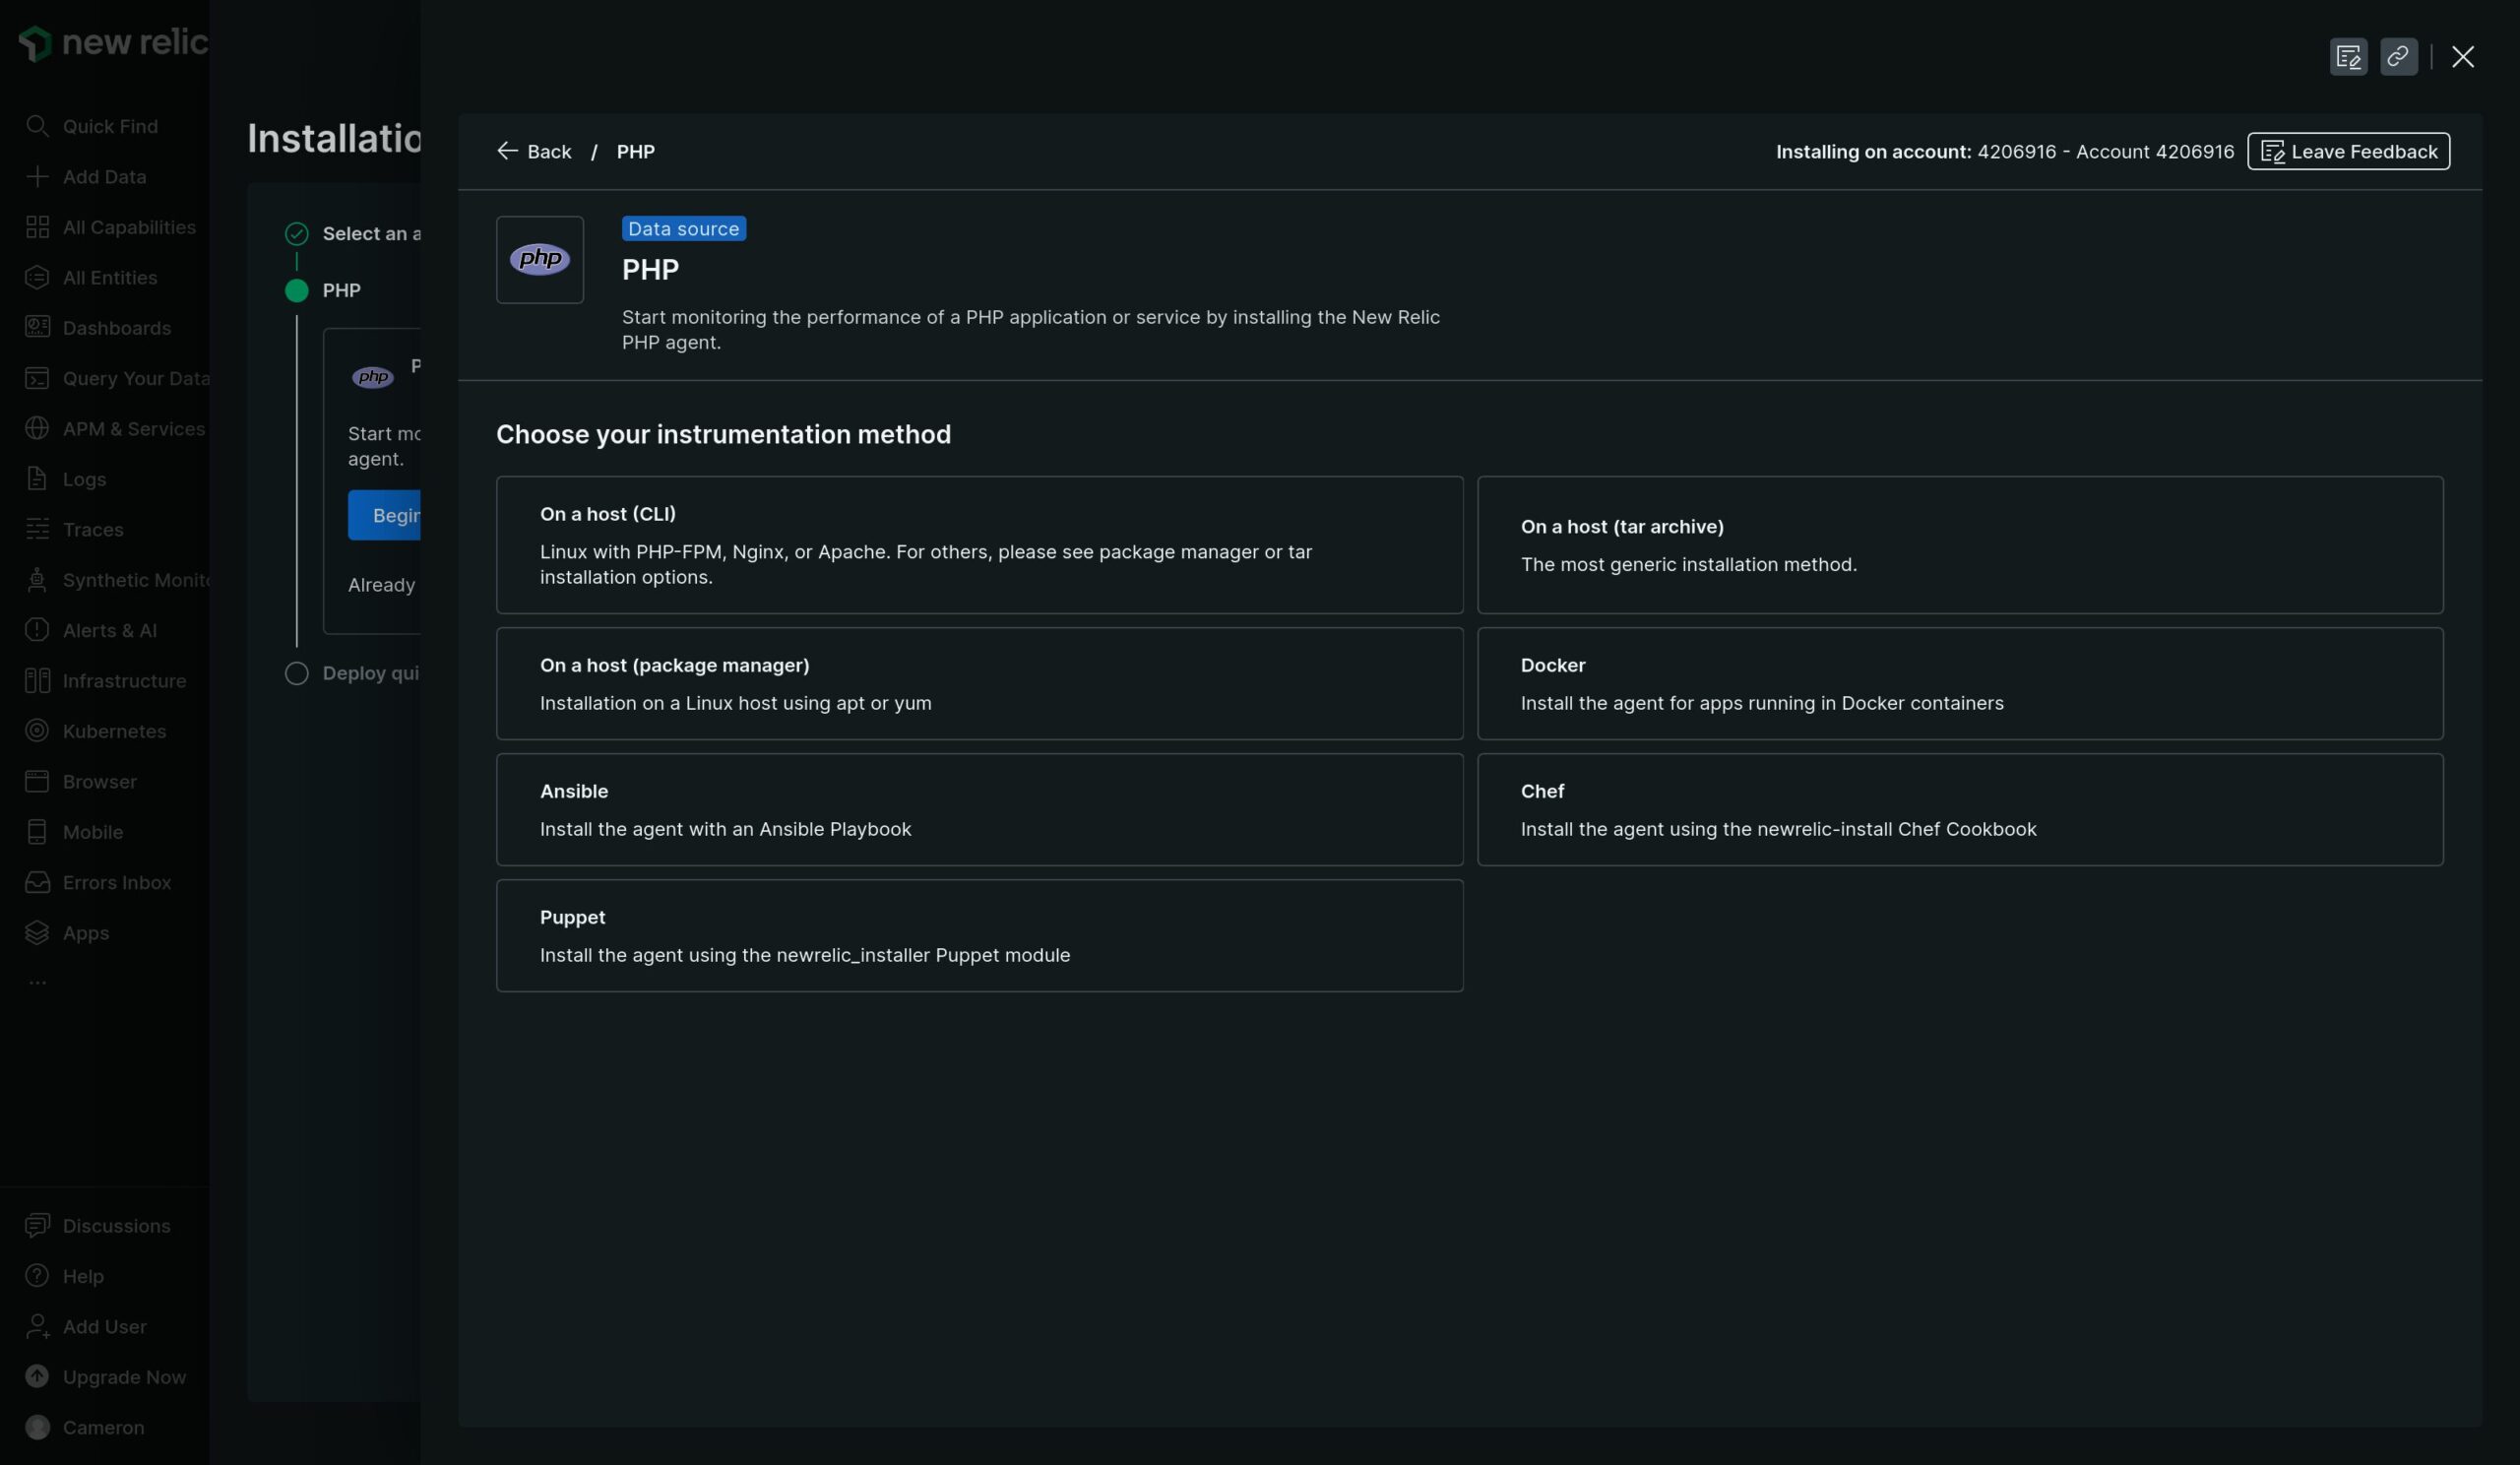
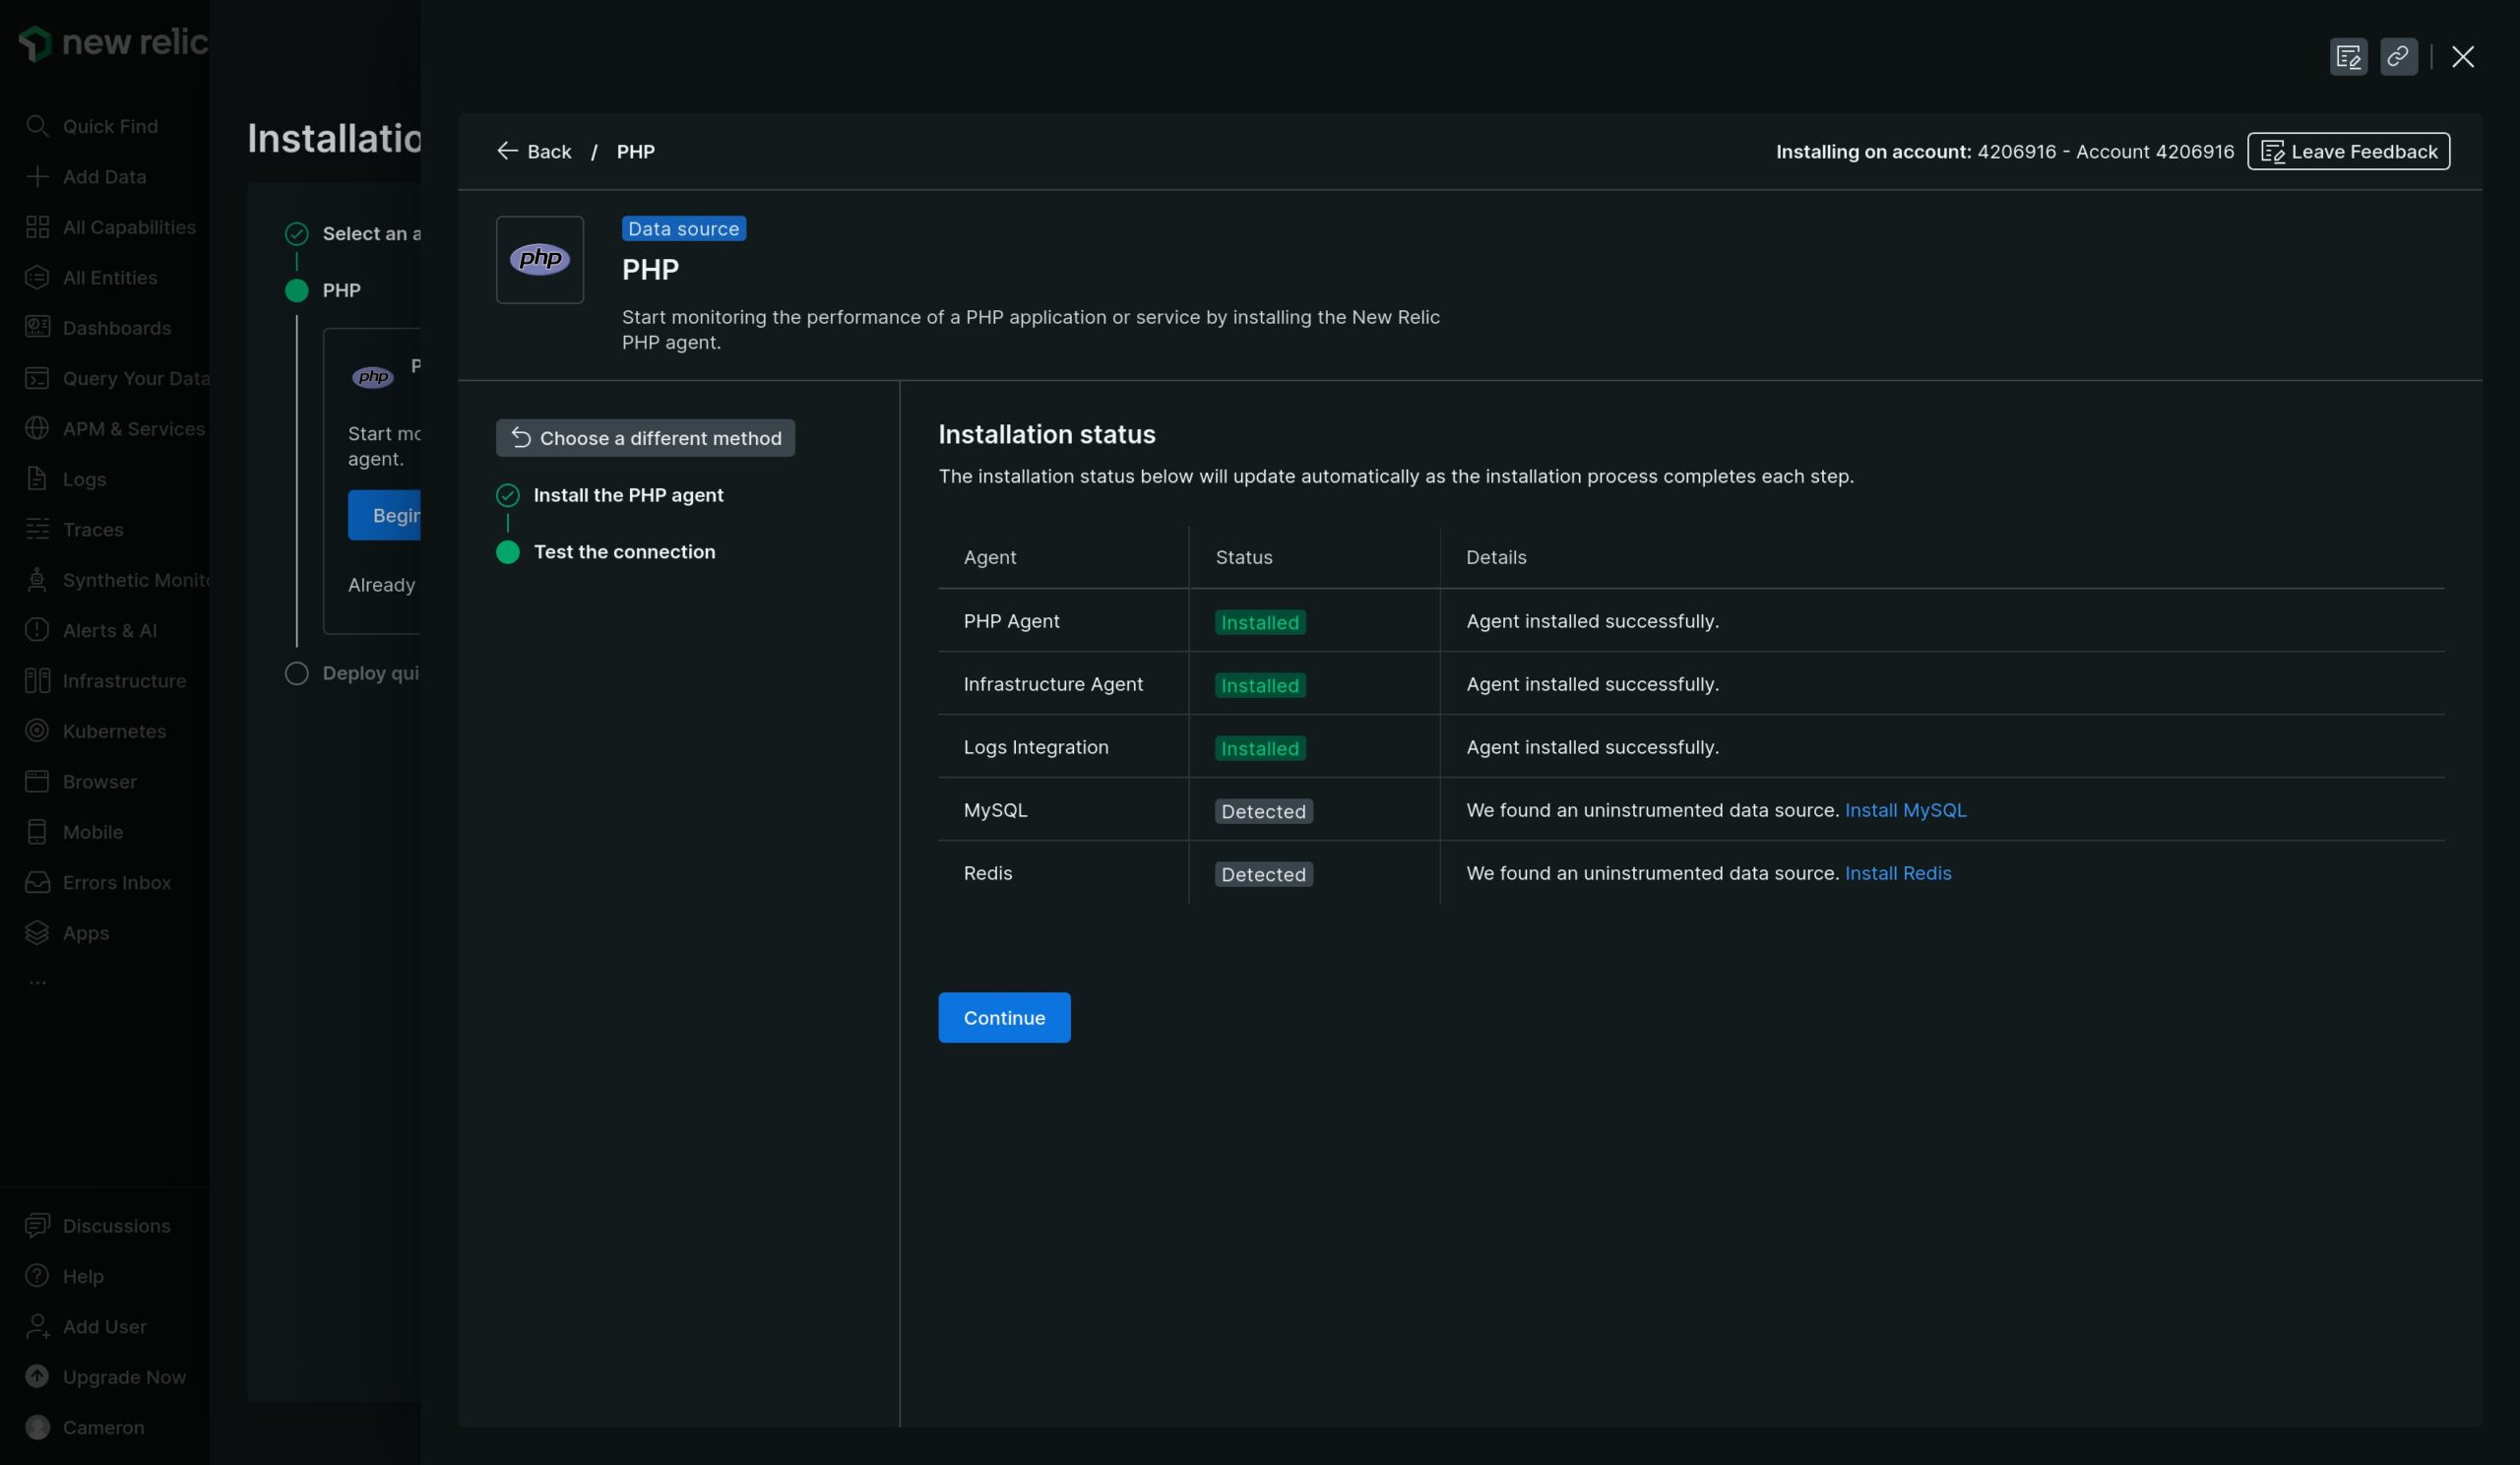
Next, you will be given a command to run on your host via SSH. This command will download the New Relic agent and install it for you. This step can take some time, and may prompt you for additional details, such as your application/site name, but once it is complete, click Continue to proceed to the next screen where you can test that the PHP data source is configured correctly:
If your server is managed by SpinupWP, you can run the commands using a sudo user.
The CLI process may have trouble restarting php-fpm automatically. To resolve this, when prompted with Restart the PHP web service after PHP agent installation?...
select n.
By selecting this, the New Relic’s CLI process will pause during processing and prompt you to restart php-fpm rather than attempting to do so automatically. When this step comes up, you should open a second SSH session as the same sudo user and restart php-fpm.
To do this, the command you run will need to be adapted to the php version you are using. To restart php 8.2, for example, use:
sudo service php8.2-fpm restart
You should also restart nginx at this point:
sudo service nginx restart
Depending on your setup, New Relic might detect additional data sources it can configure, like the MySQL and Redis entries in the above screenshot. It is recommended to install these as well for maximum data coverage. The process is similar to the steps for installing New Relic’s PHP agent from the previous step. Both the MySQL and Redis agents will require you to run some additional commands to set up user accounts for New Relic so that it can pull the necessary data. Select the most appropriate installation method – usually “On a host”, and follow the prompts. Once all additional agents are installed, New Relic will test that all data sources are working correctly:
If your server is managed by SpinupWP, note that no Redis password or ACL configuration is in use, and you can skip these steps during the Redis process.
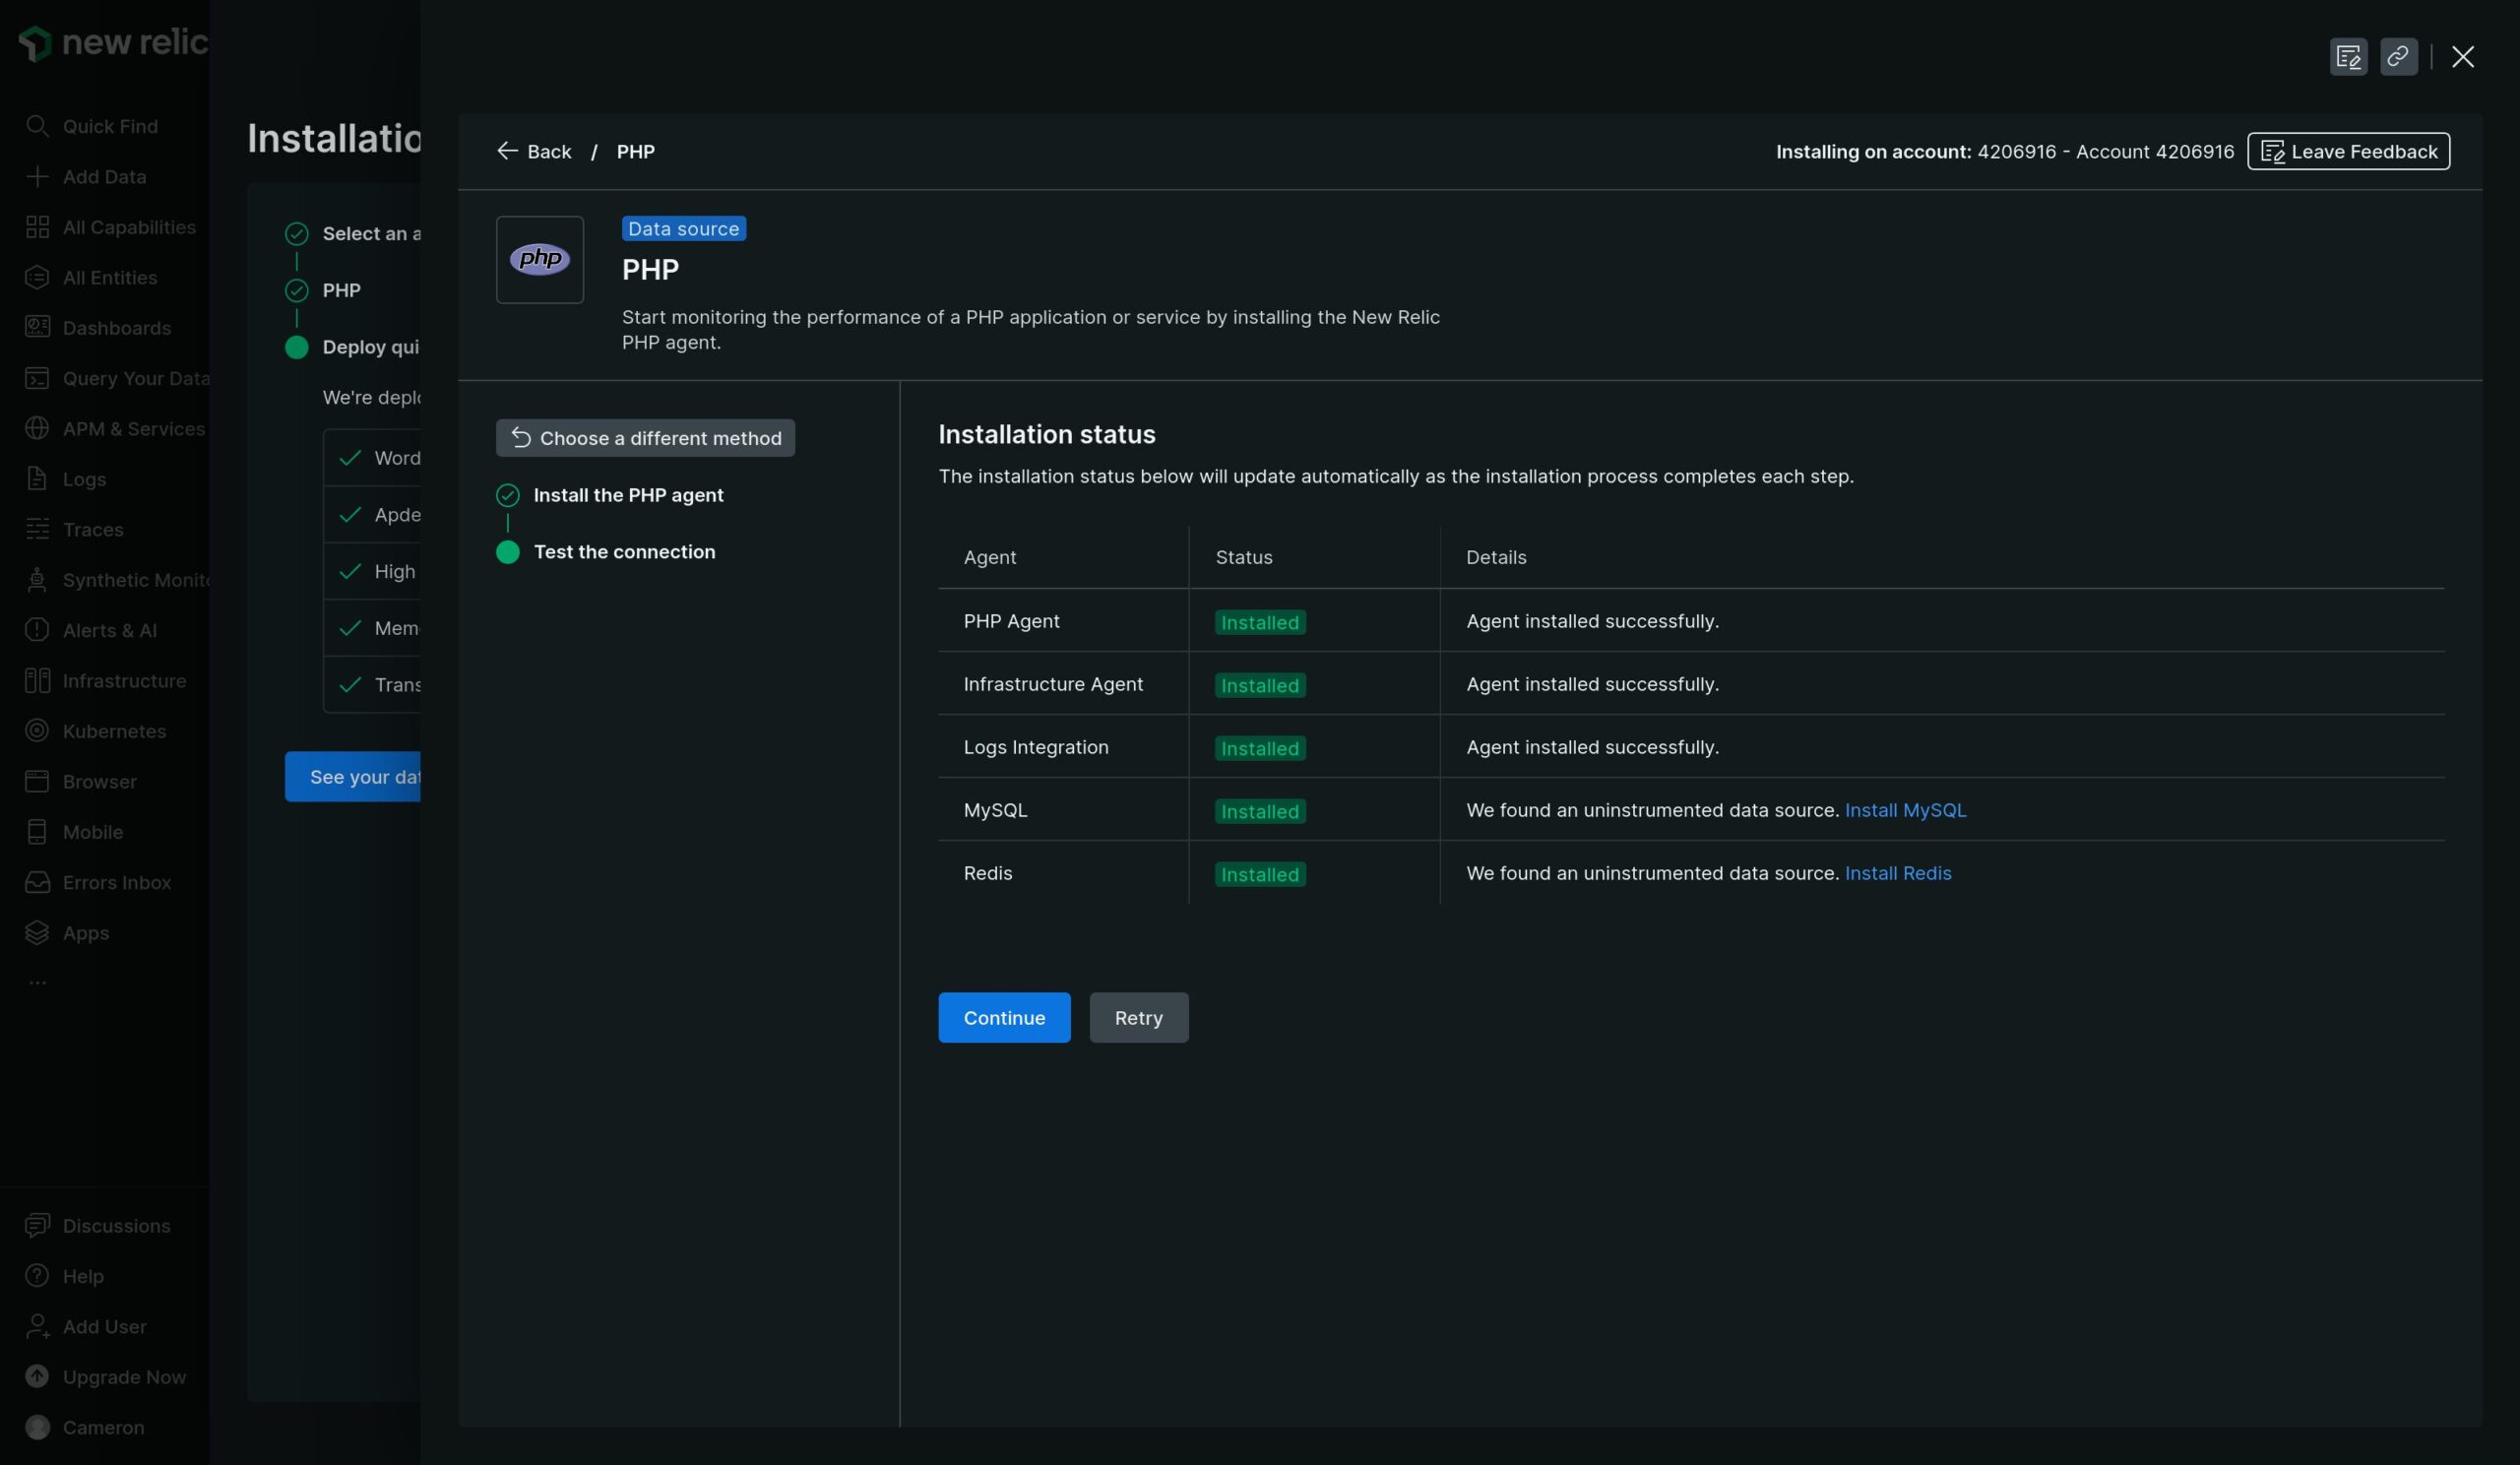
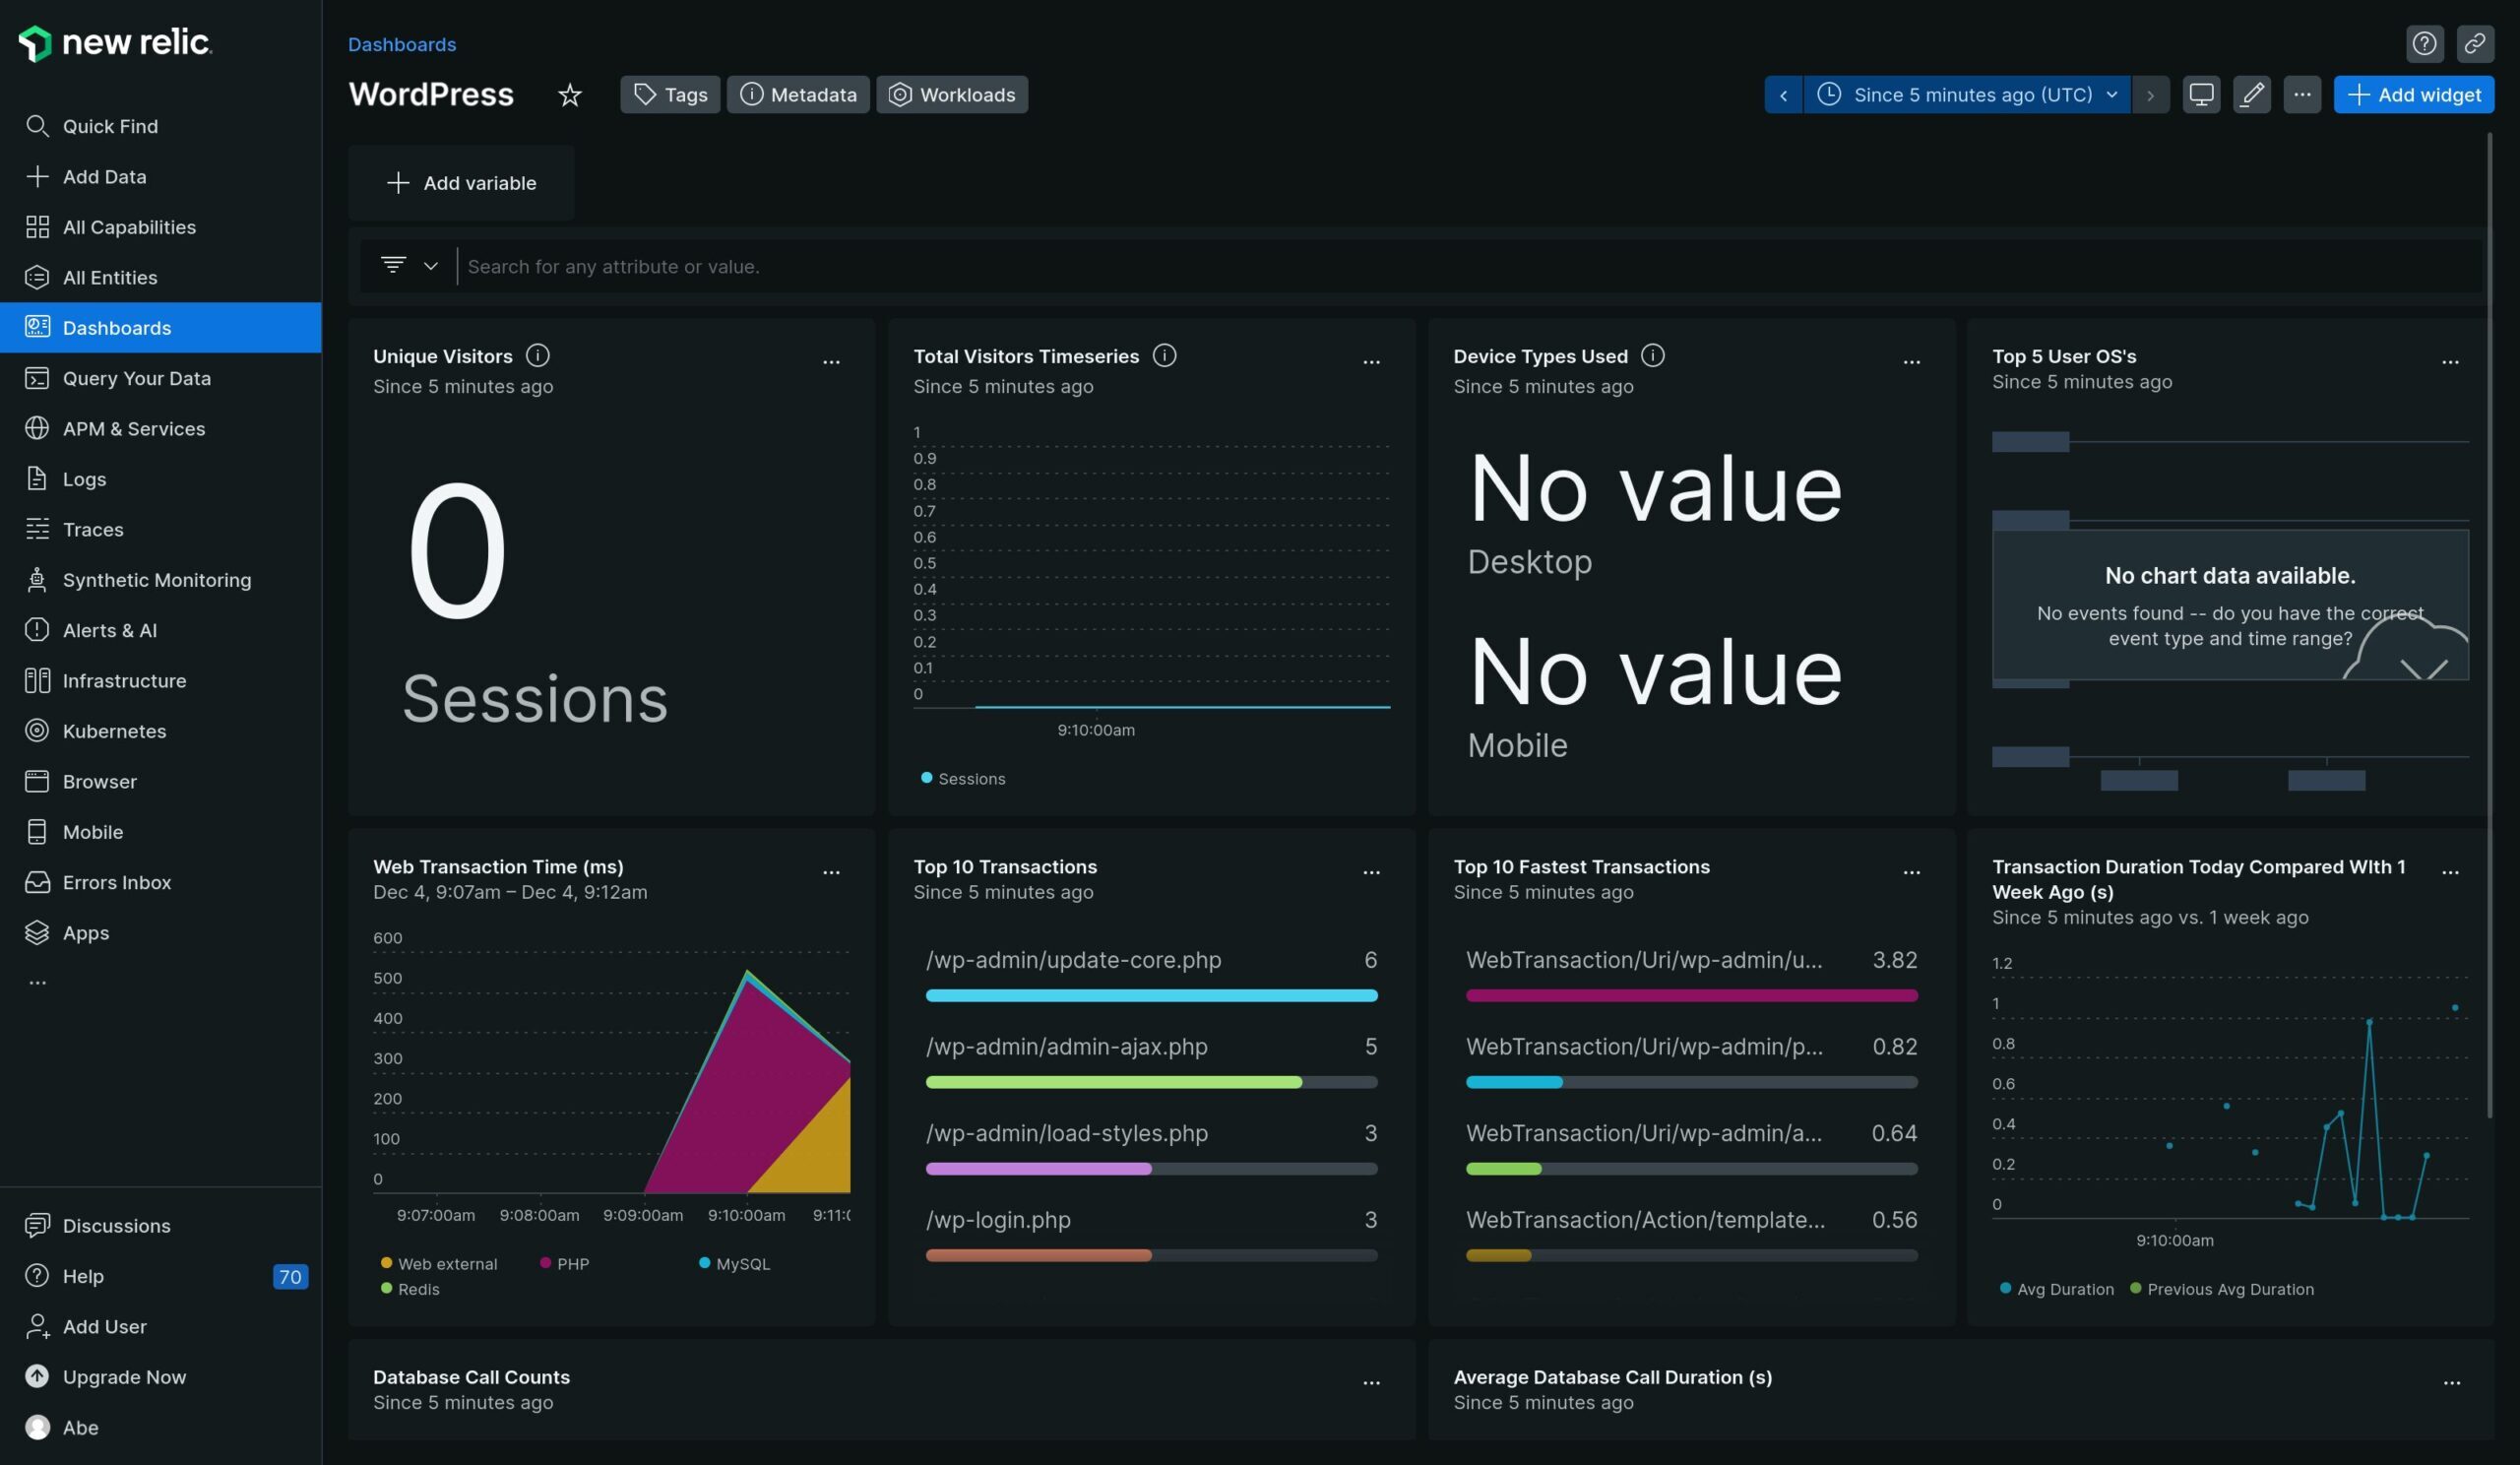
Once everything is working, New Relic will prompt you to See your data, at which point you will be taken to the default WordPress dashboard:
Using New Relic with WordPress
New Relic gives you a lot of flexibility to query the data that it gathers and create your own views to derive specific insights. However, one of the benefits of using the provided WordPress configuration is that it comes with some useful data views that you can get started with immediately.
The go-to view to get a snapshot of your site’s health and performance is the included dashboard. You can access your list of dashboards anytime from the Dashboards item in the left-hand navigation menu. At a glance, this dashboard shows you things like:
- Top 10 Transactions – which pages on your sites have received the most visits in the timeframe.
- Database call counts and Average database call duration – shows you what sort of load is on your database in the given timeframe.
- Transaction duration today compared with one week ago – shows you how your site’s performance has changed since last week. This can be useful if you’ve recently made some changes and are curious about what kind of impact they’ve had.
Aside from the dashboard, there are also some more specialized views. If you navigate in the left-hand navigation menu to APM & Services and then select the name of your WordPress site (this is the name you set during the initial setup of the New Relic integration), you’ll be greeted with more in-depth information about particular aspects of your site, divided into sections.
Summary
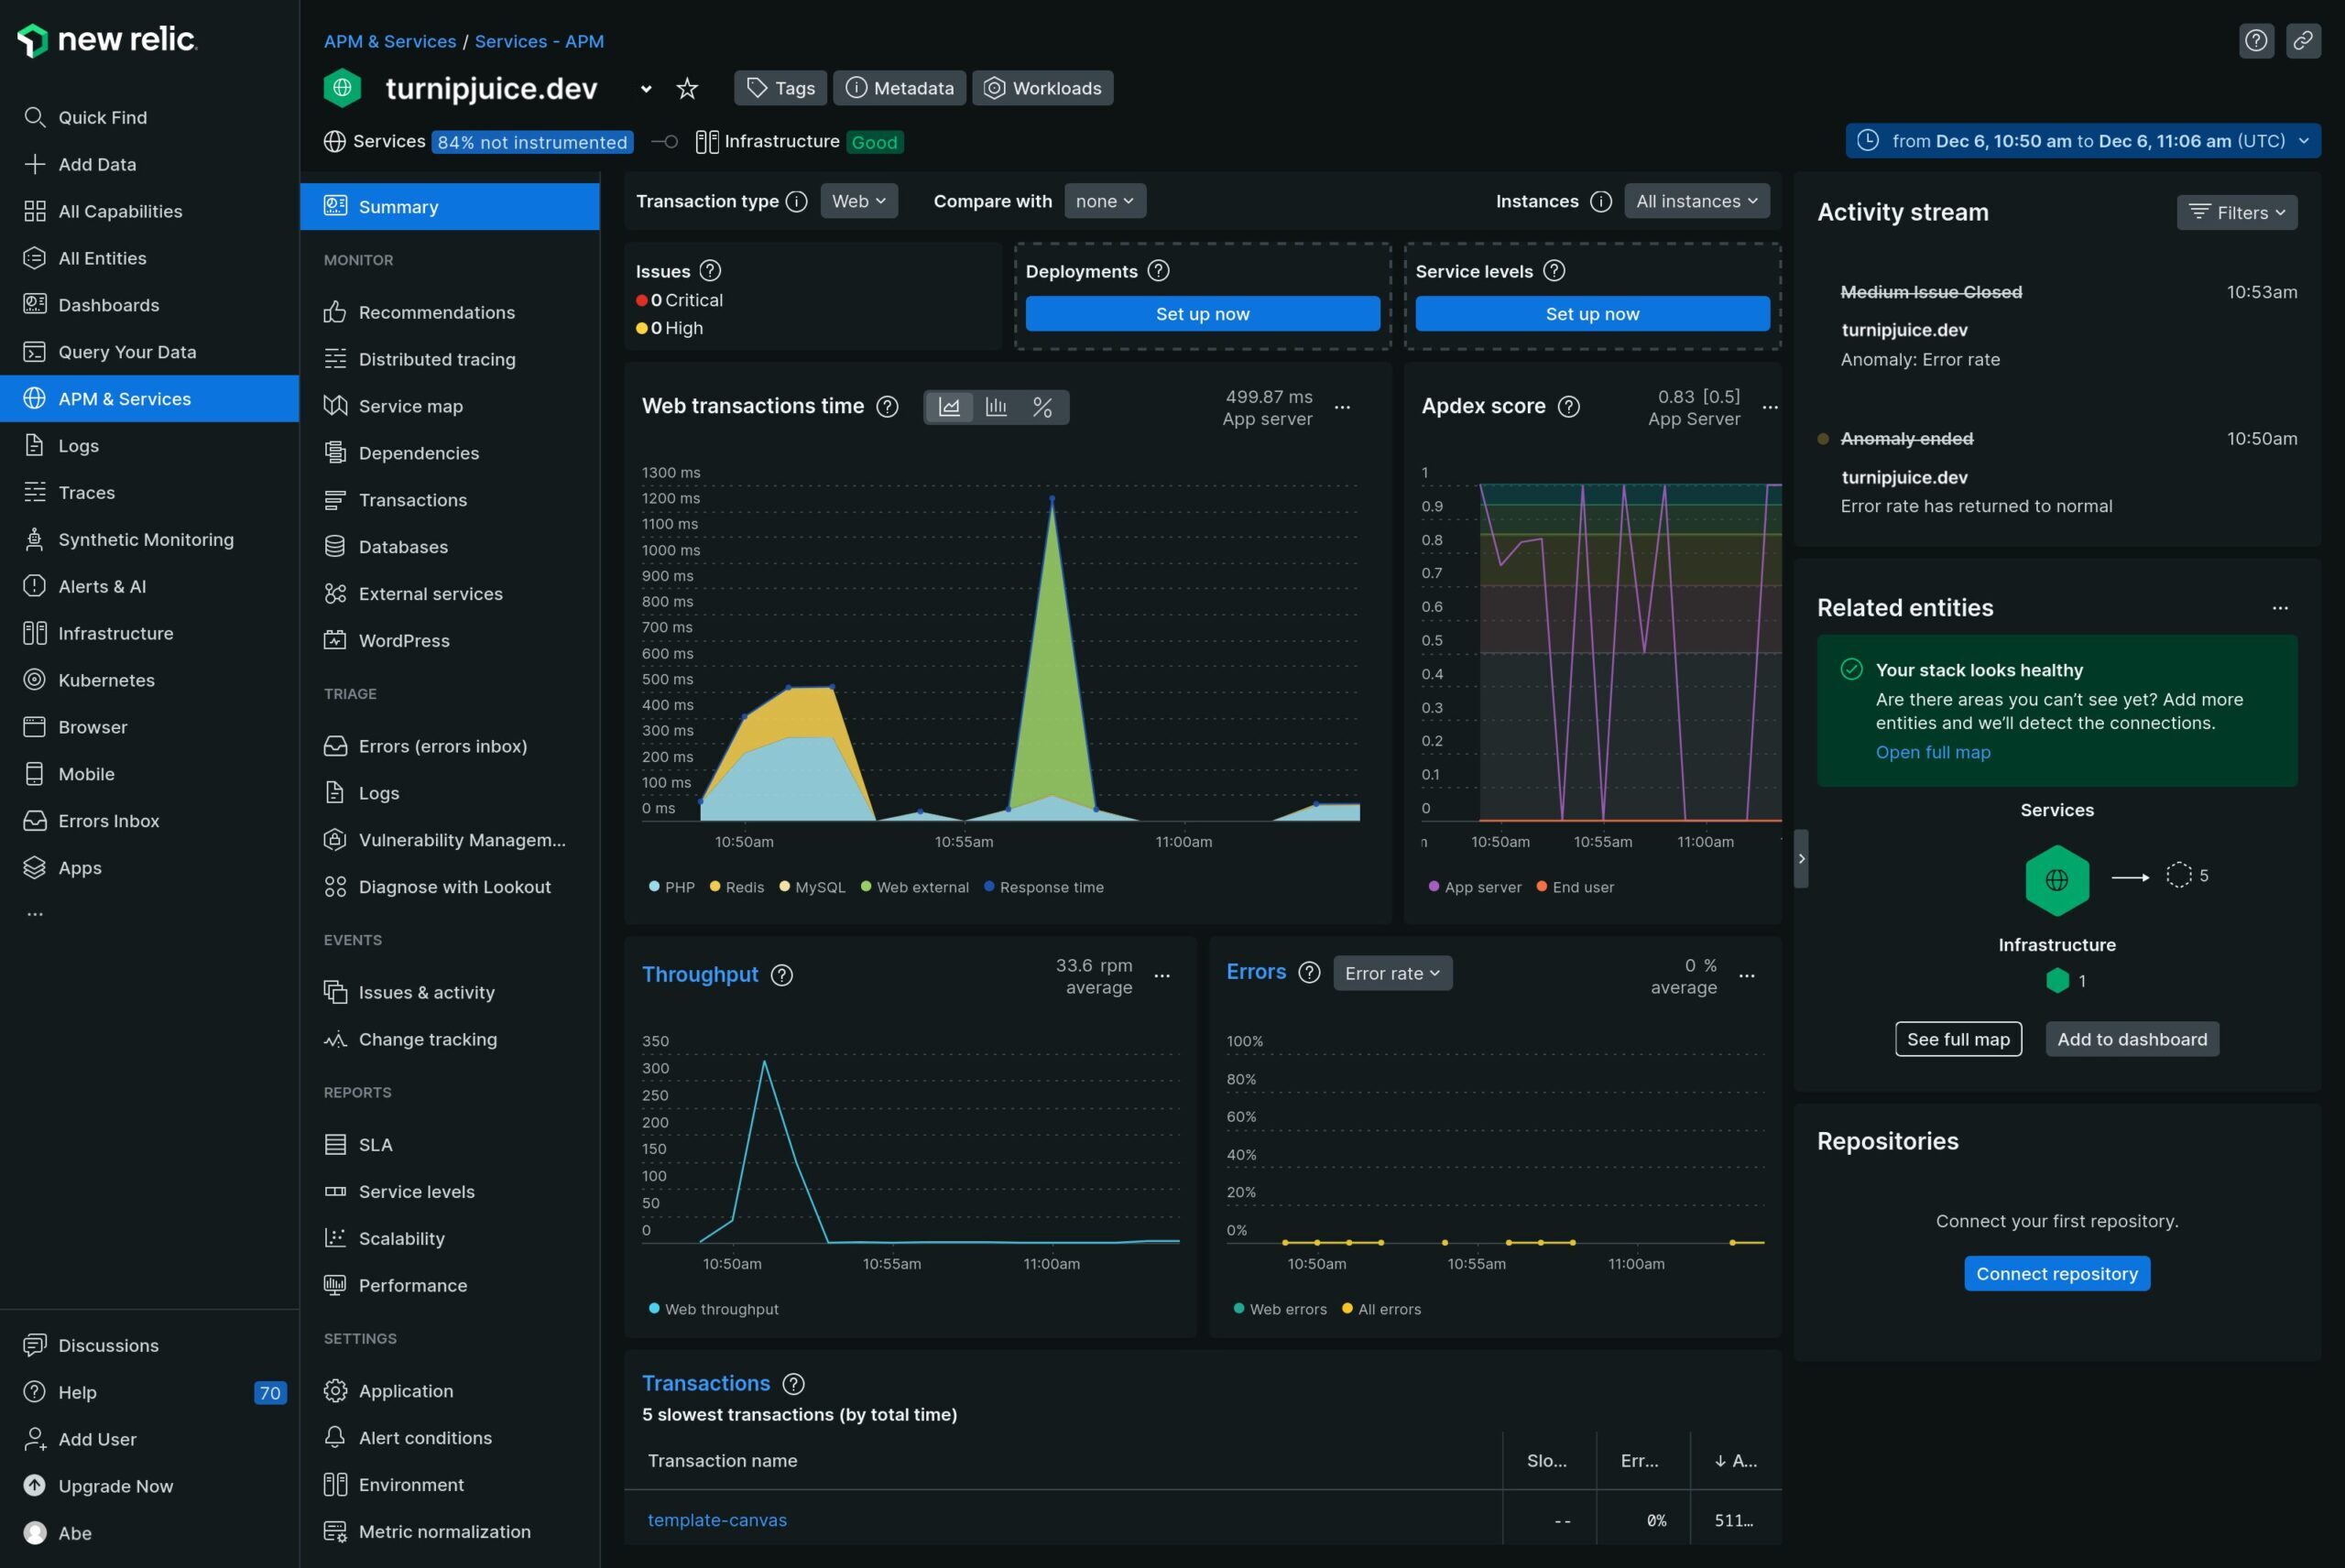
Similar to the dashboard, the summary screen gives you a high-level snapshot of how your site is doing. While it can’t help you debug any in-depth issues, it serves to alert you to anomalies such as abnormal transaction times, throughput, or spikes in errors.
Transactions
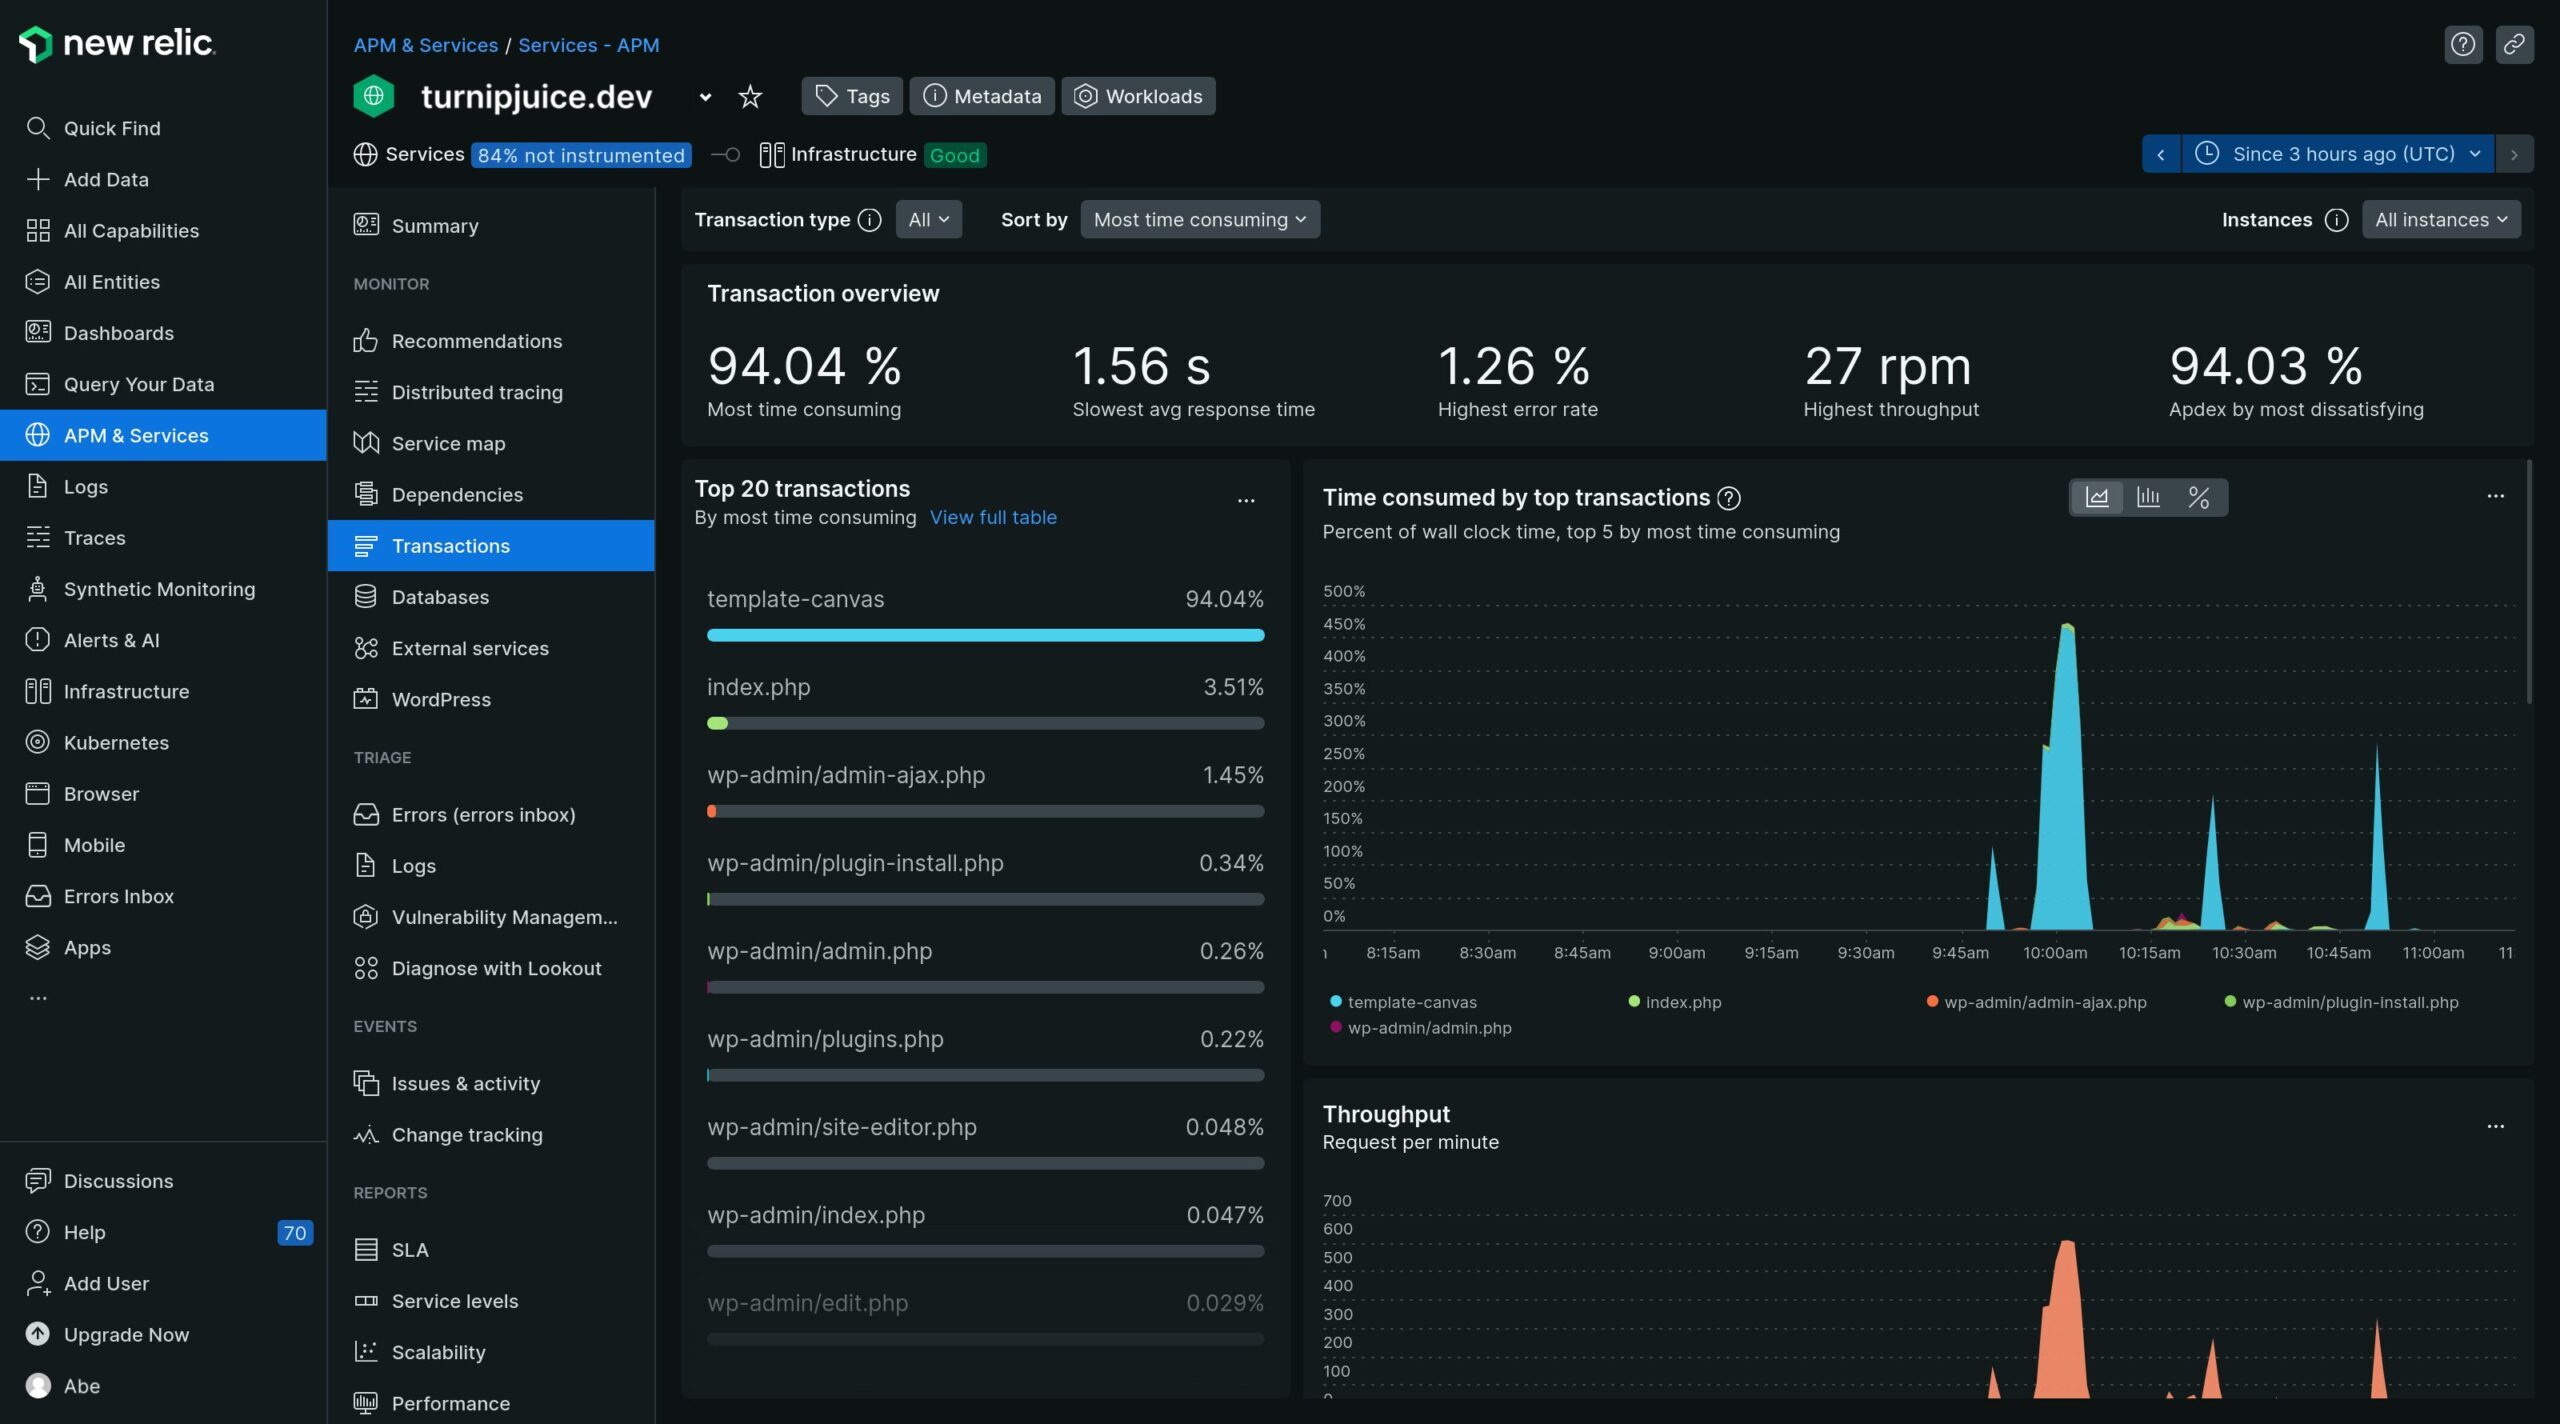
The purpose of the transactions page is to help you identify transactions that could benefit from fine-tuning and to help narrow down the cause of errors. The information on the transactions page is quite dense and can sometimes be difficult to work through. However, it provides a wealth of information that can be very helpful in performance-tuning efforts, as you will see in the next section.
Databases
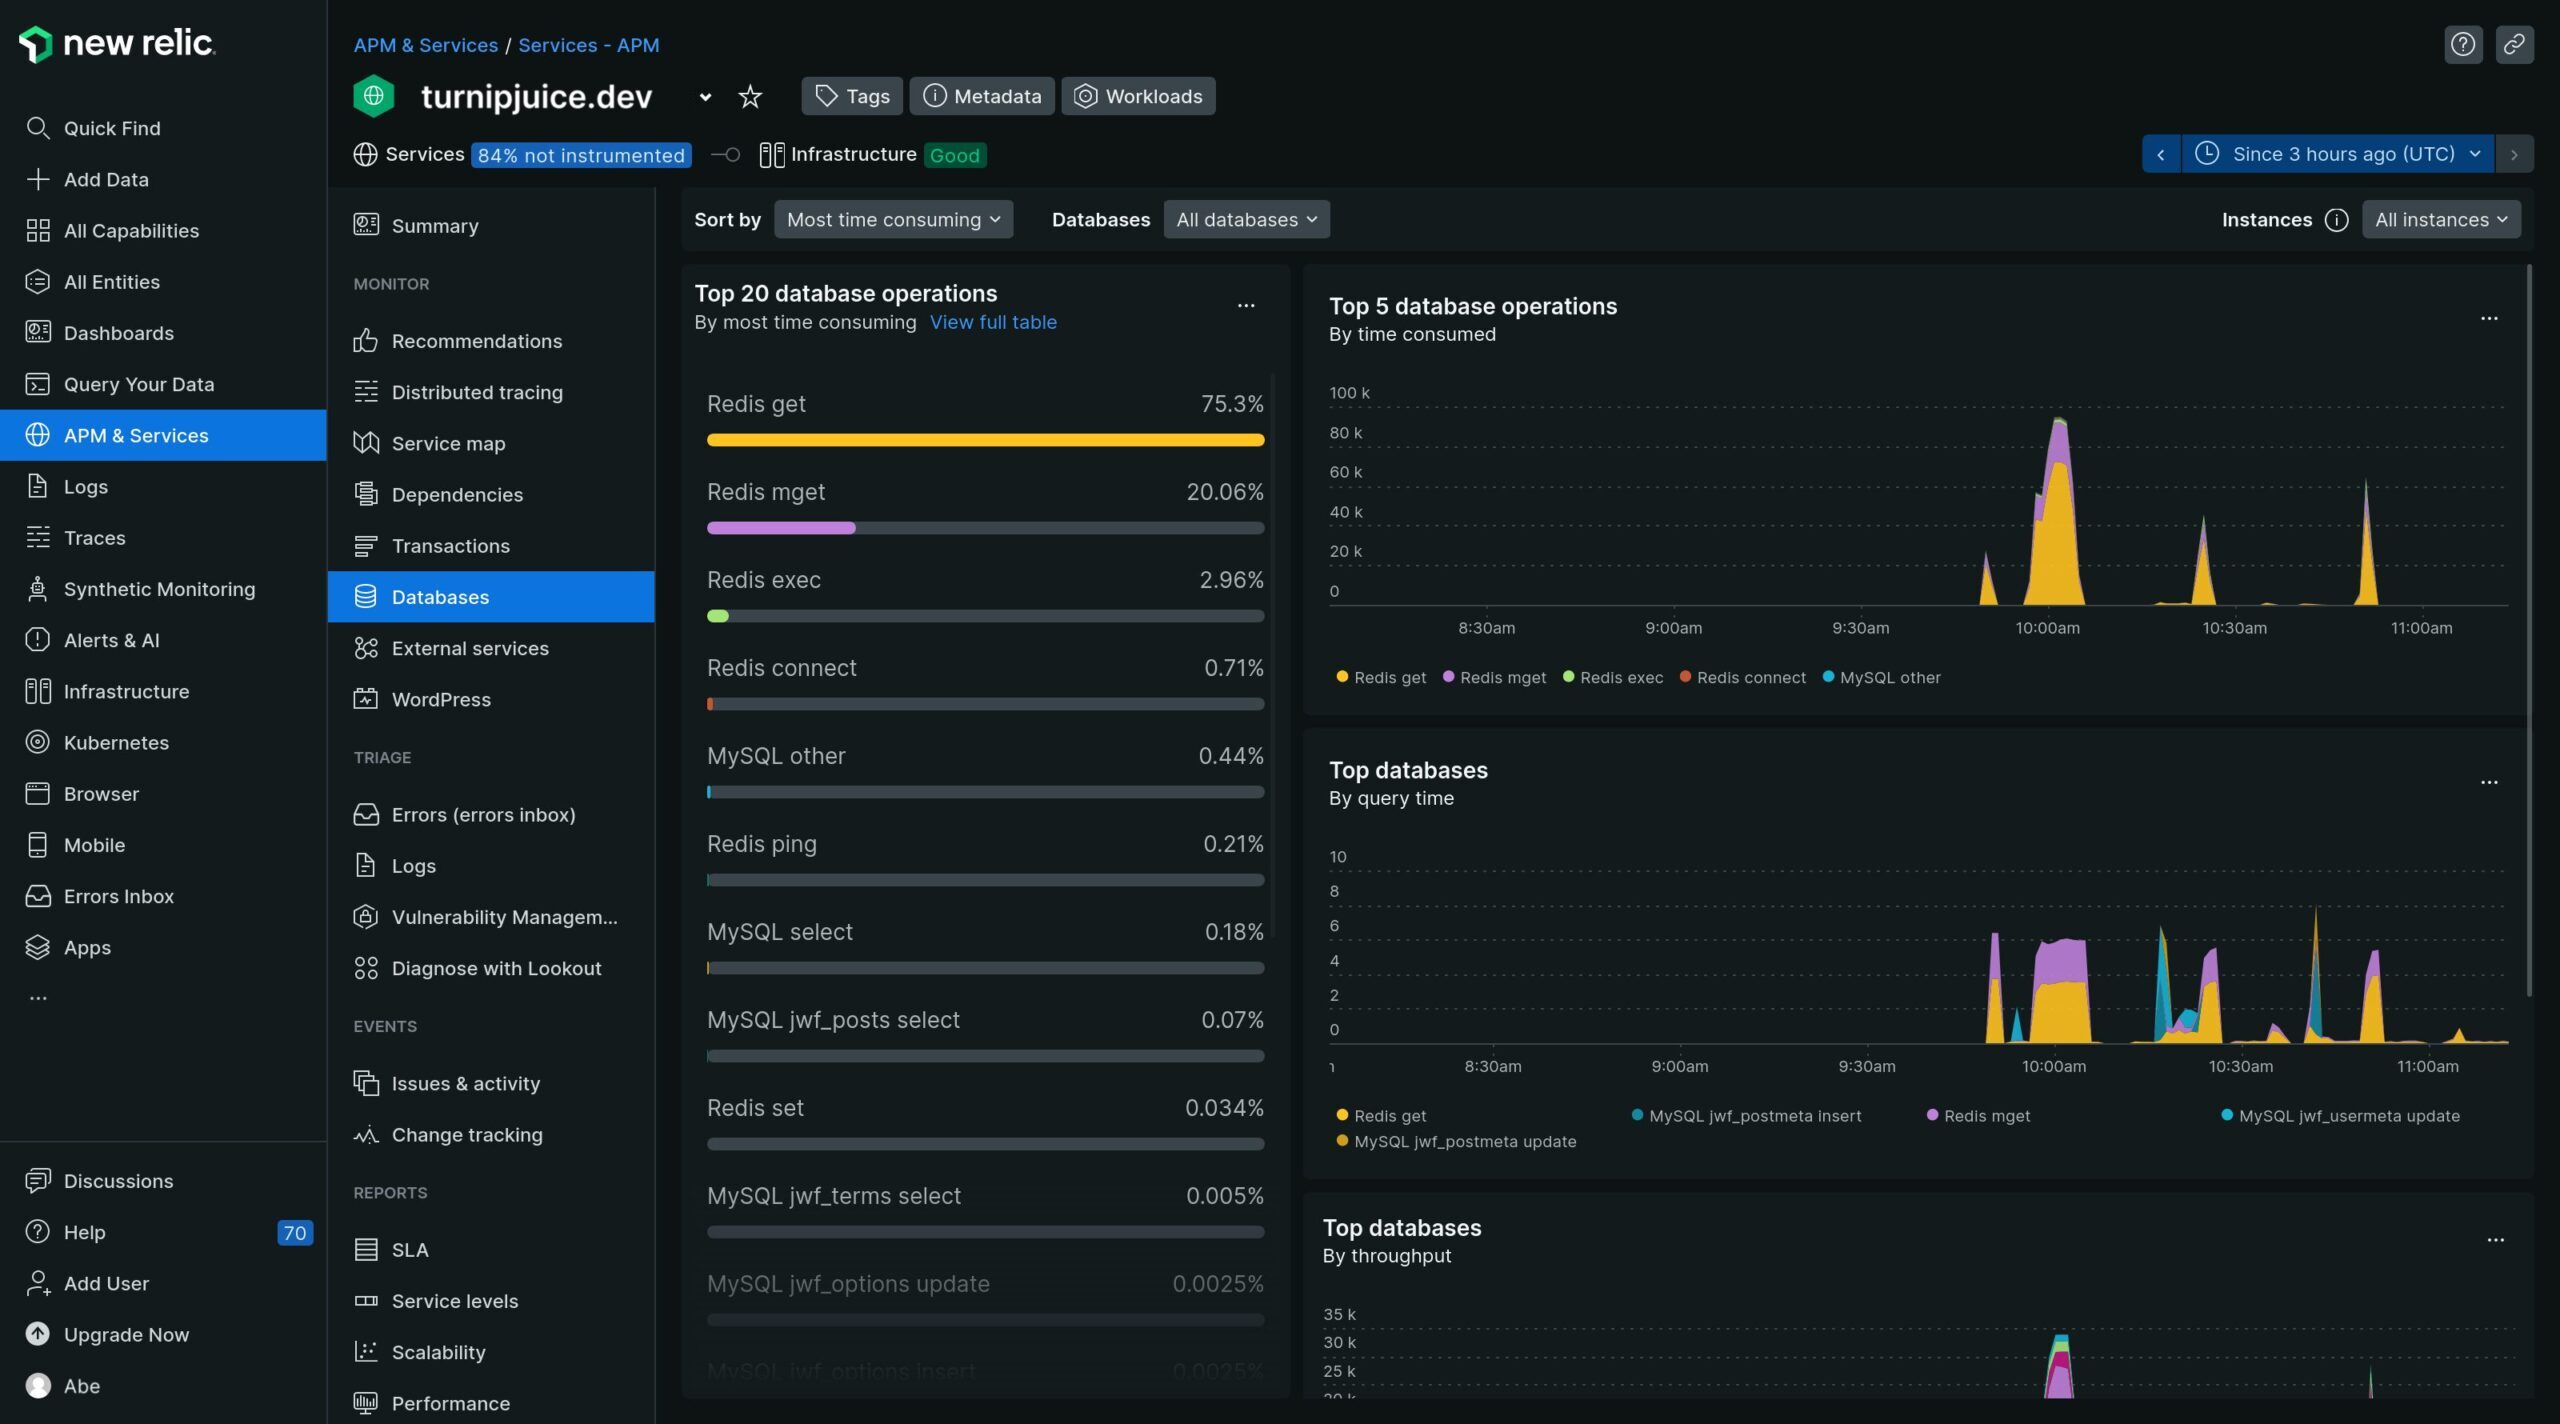
The databases screen provides insight into why database operations are consuming the most time. You will find details about your relational database, like MySQL, Postgres, or MariaDB, and other data stores, like Redis. Using this screen, you can identify if there is any abnormal or unexpected database activity going on at a glance.
External Services
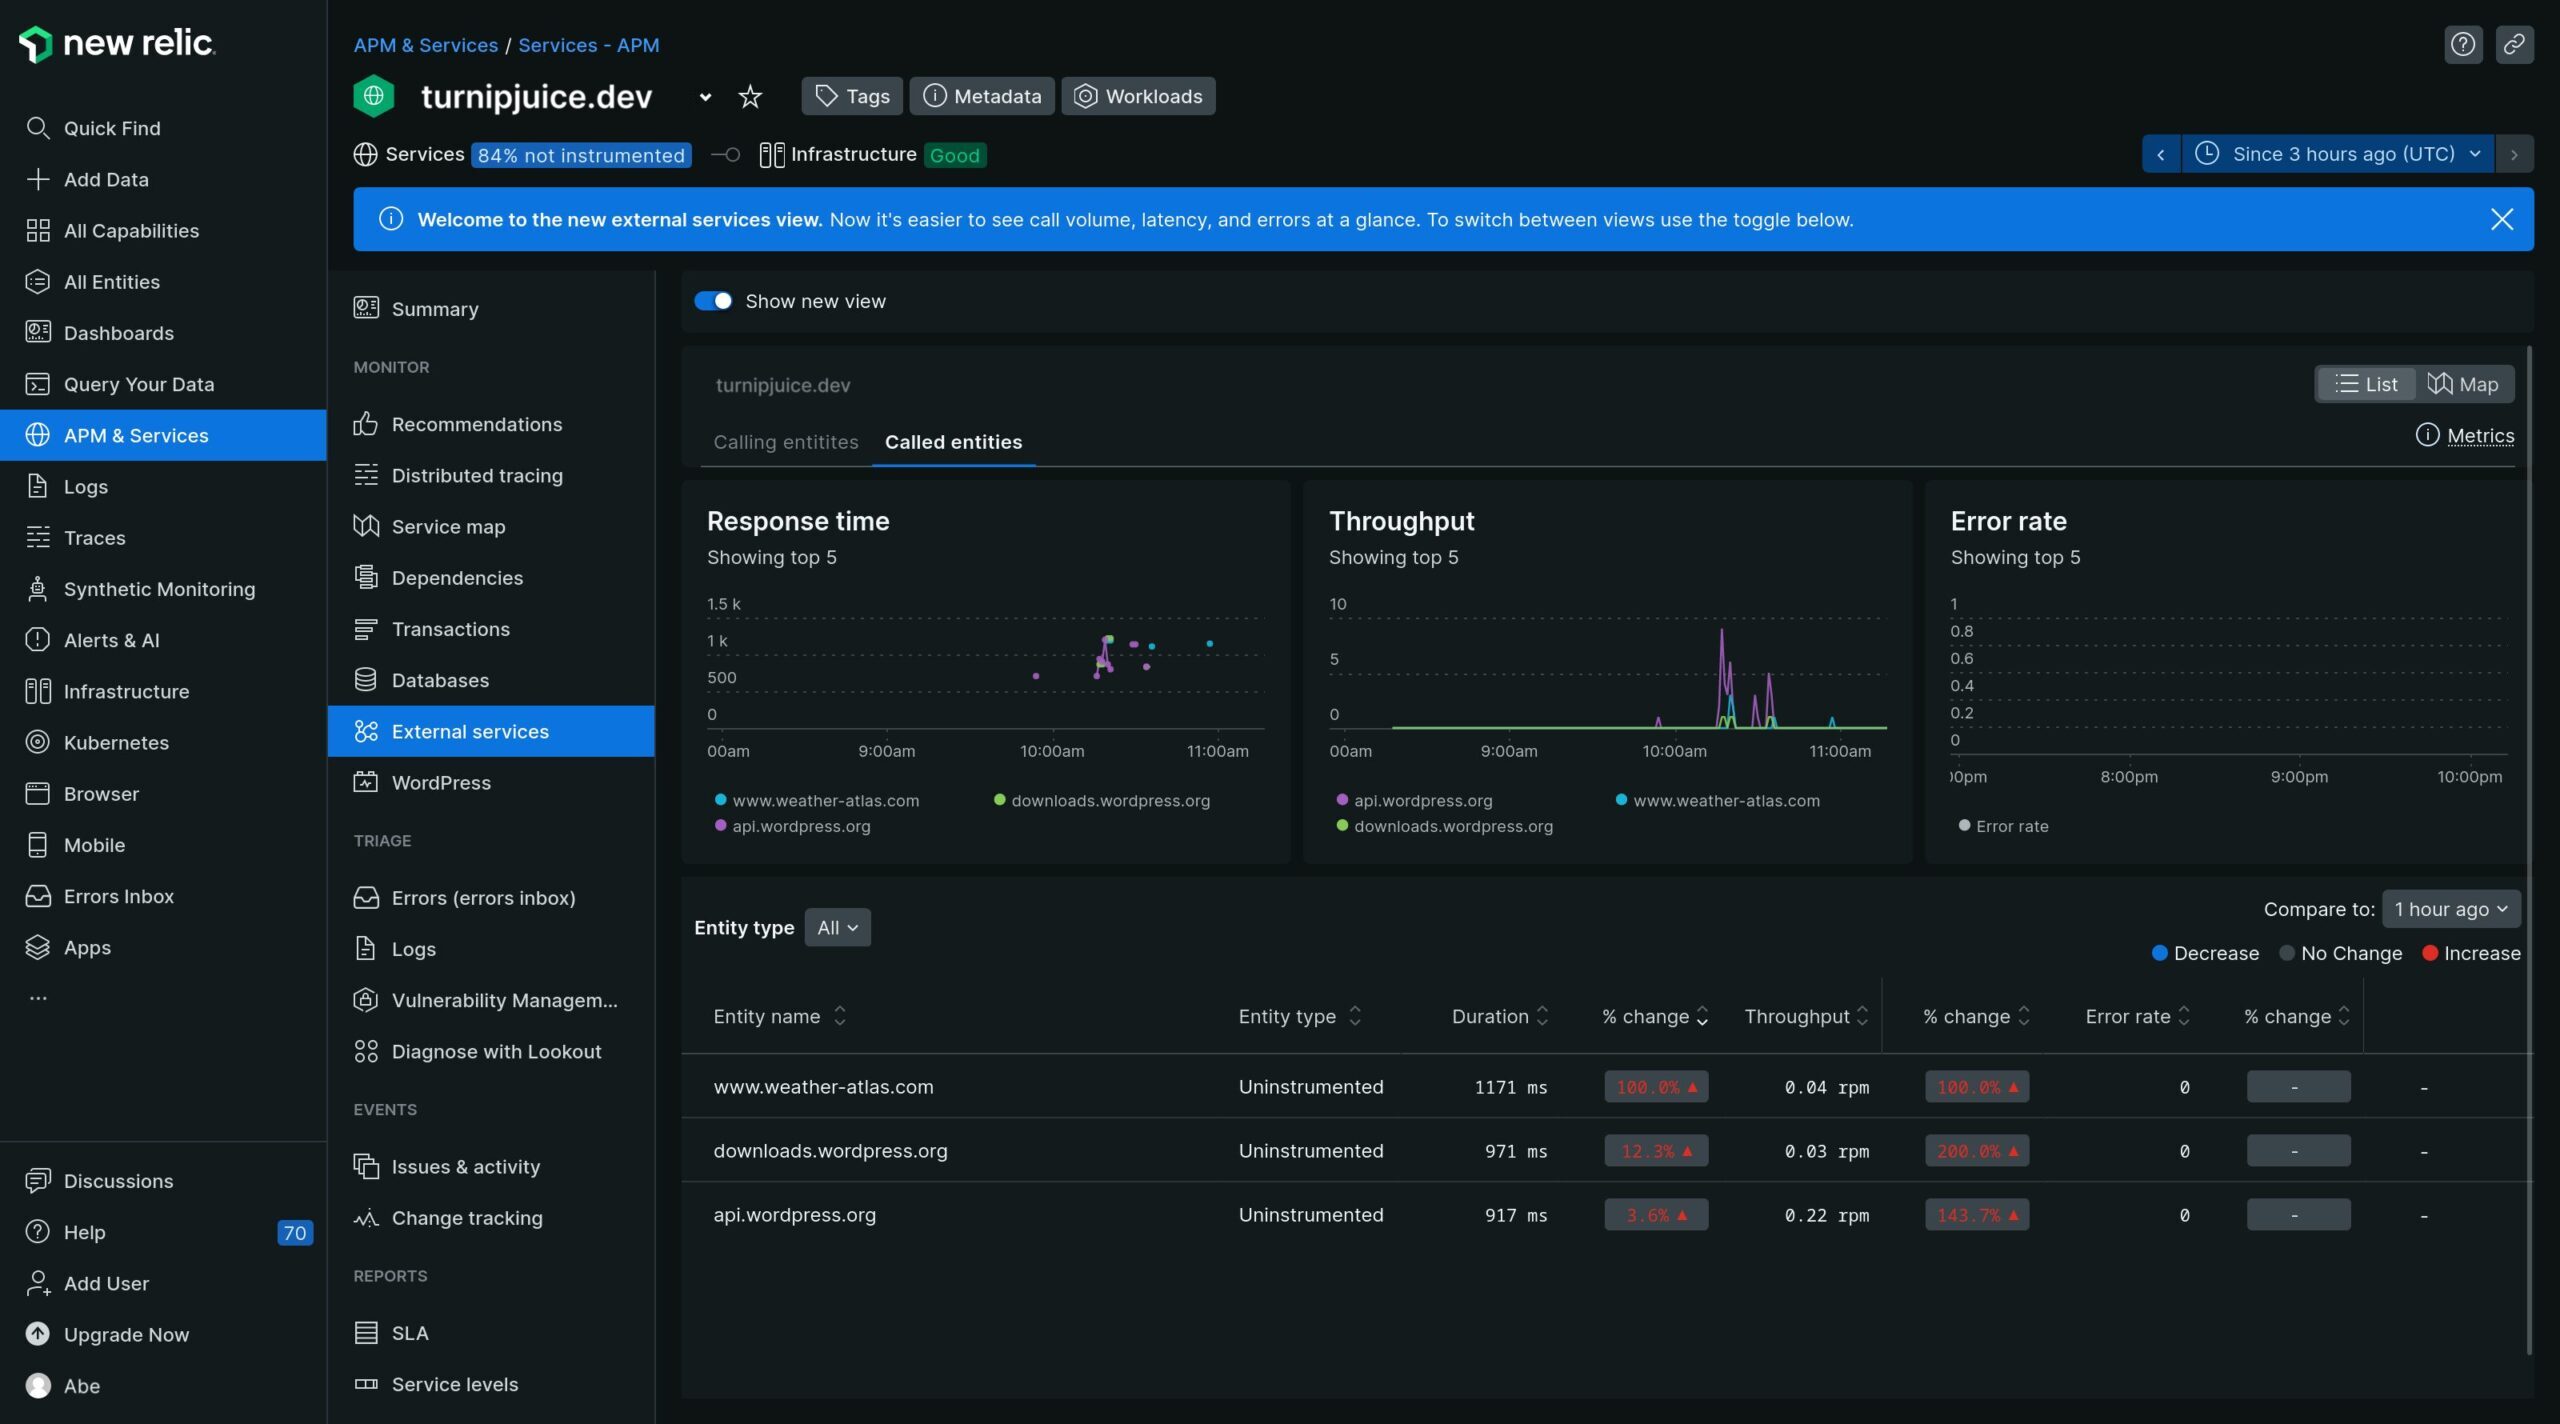
The external services screen shows you how much time is being spent communicating with external servers. This is especially common with third-party plugins whose functionality relies on external APIs. These external connections can cause bottlenecks and slow your site down if you aren’t careful, so having a way to see the impact and where it is coming from can be quite helpful.
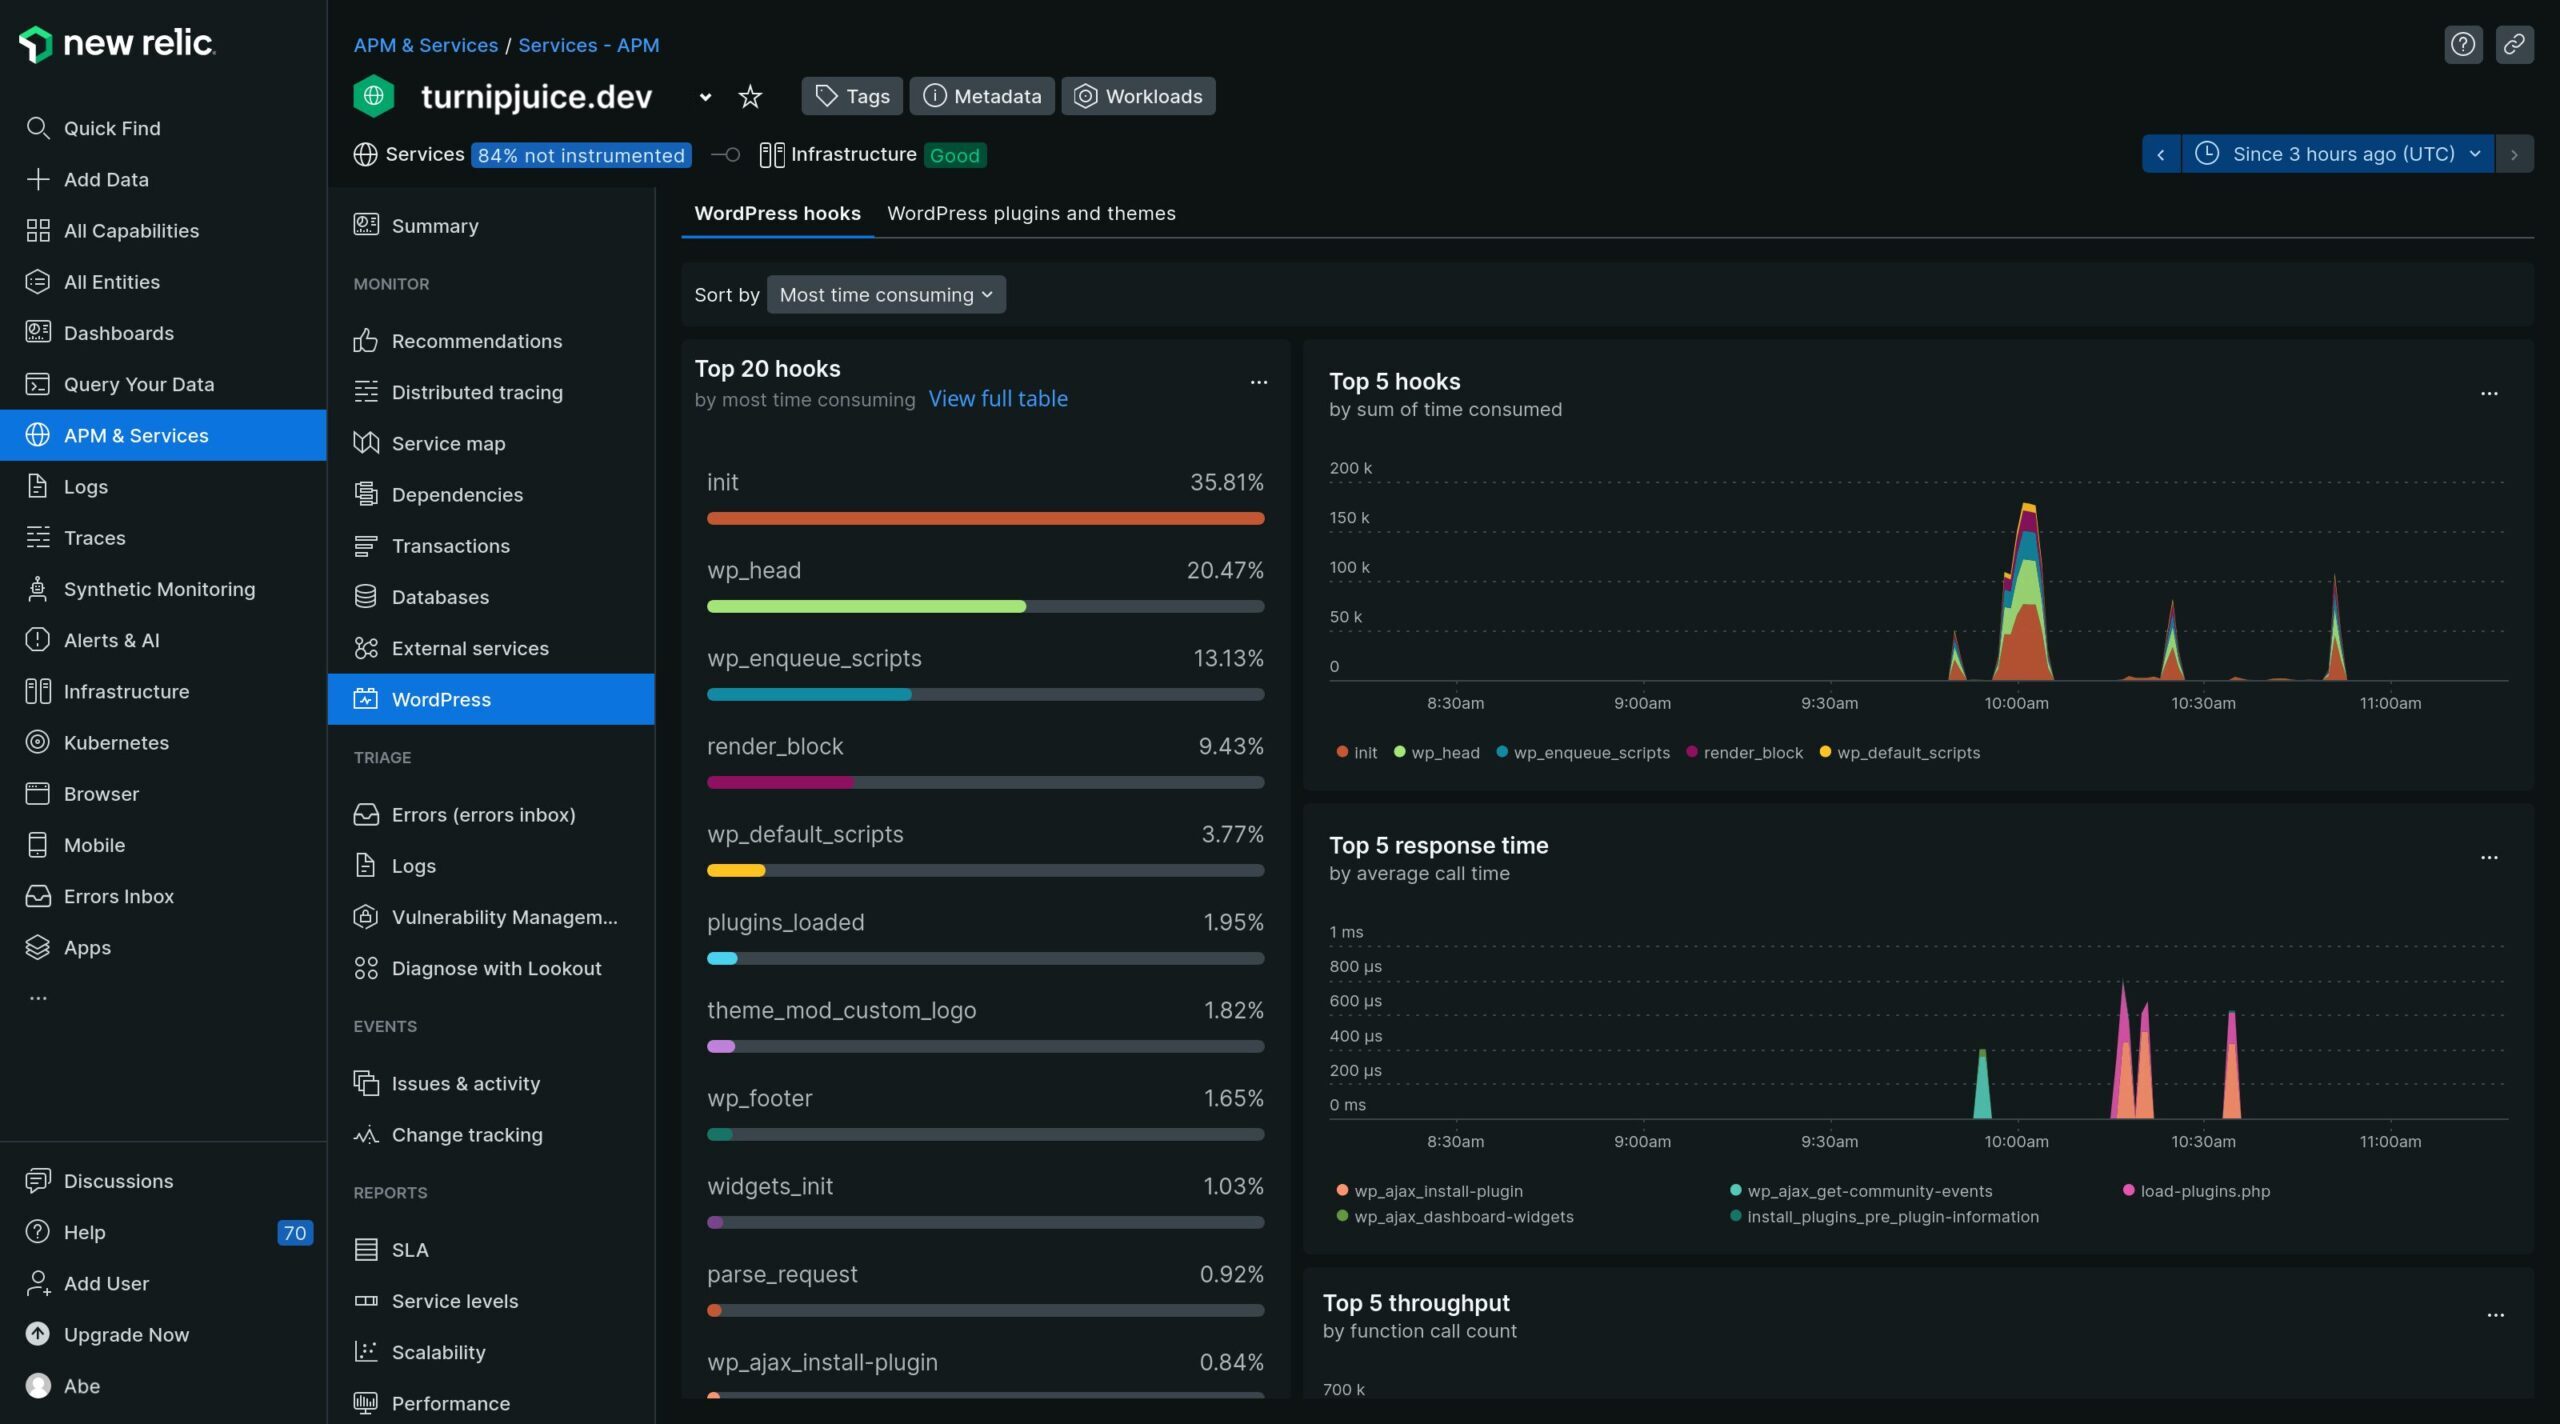
WordPress Hooks, Plugins, and Themes
One of the WordPress-specific pieces of functionality. This page highlights which hooks, plugins, and themes are taking time and how often they run. This can be useful in identifying if non-vital third-party components are having an outsized impact on your site’s performance.
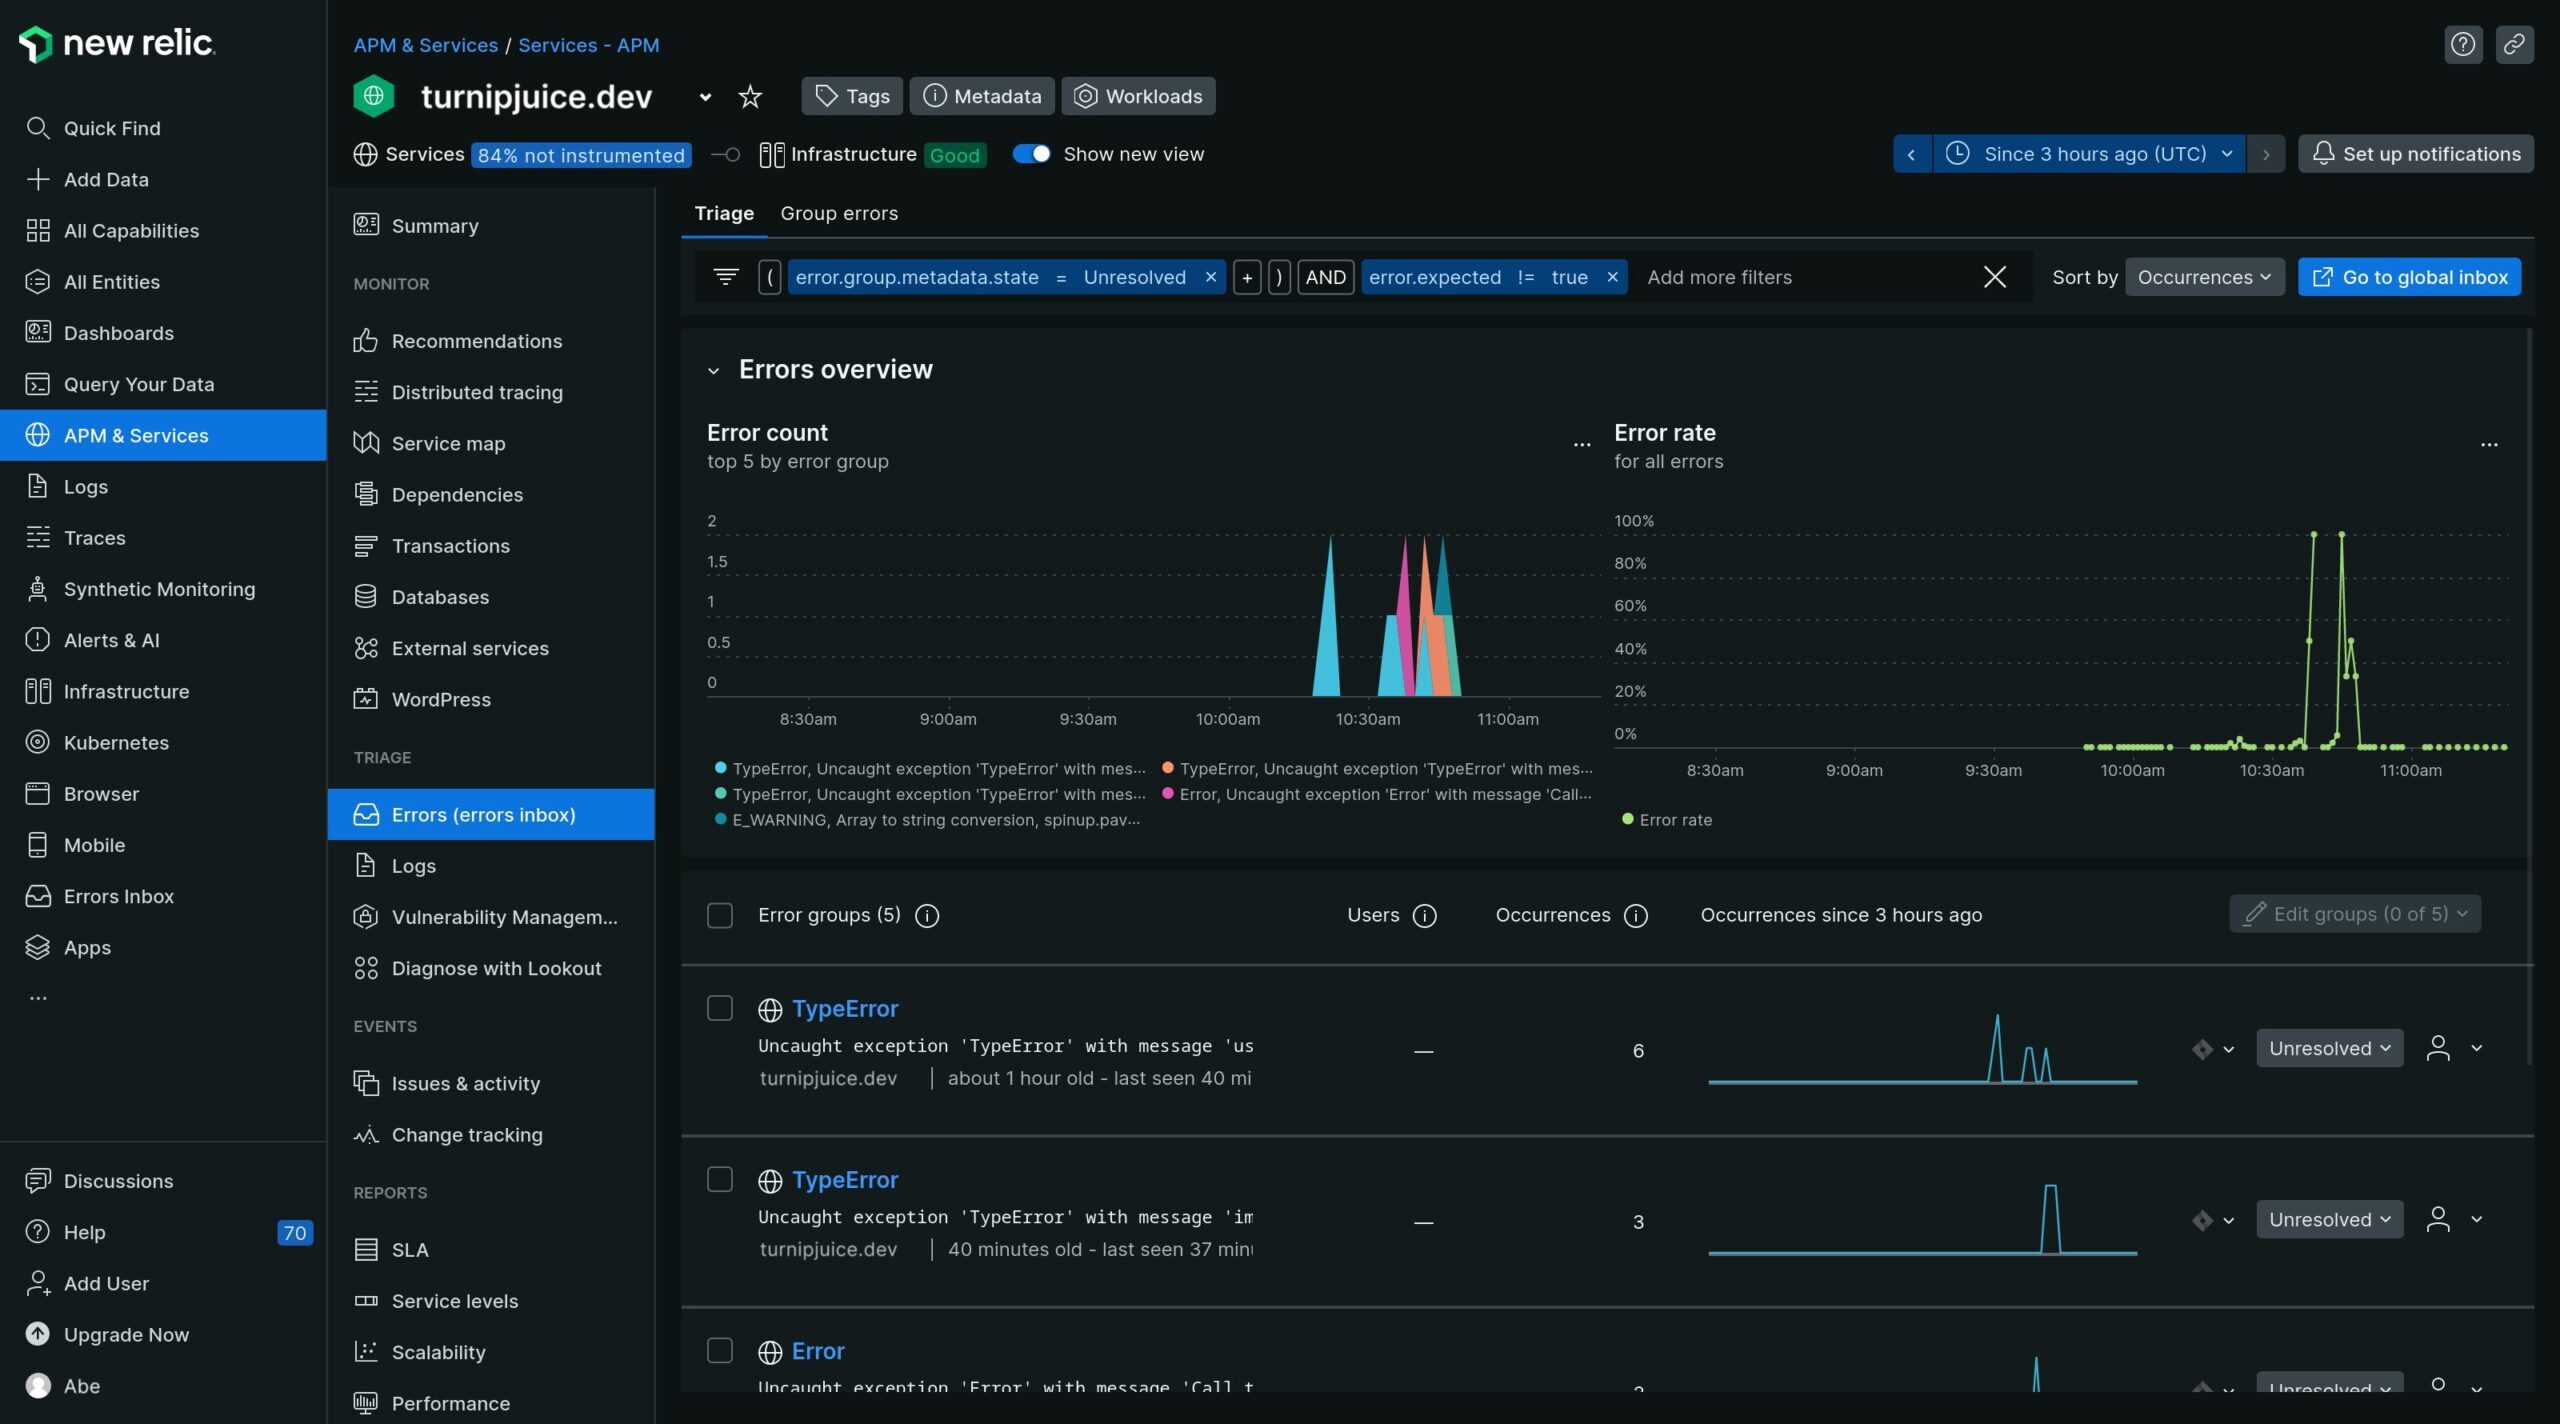
Errors Inbox
The errors inbox gives you a single place to aggregate errors coming from your site. This is especially helpful if you are running custom plugins or themes that might not be as well tested as some third-party ones, as when errors happen, they will be captured here by New Relic for you to triage at a later time.
Debugging WordPress Performance Issues with New Relic
Performance issues will vary wildly from case to case, so it is difficult to construct a universally applicable example, especially when using a demo site and a good hosting provider, as this will eliminate many common issues. As such, this scenario is contrived, but the principles still apply to debugging real-world performance issues.
In this scenario, suppose you’ve made some changes to your site recently and have noticed a performance impact. Perhaps the site is now loading significantly slower than it was a couple of days ago. In that case, the following steps could be a viable approach for troubleshooting the issue.
Investigating Transactions
The summary page is often a good place to start, as it can give you a quick overview of whether anything looks out of place. In this case, you can see that the average transaction time is rather higher:
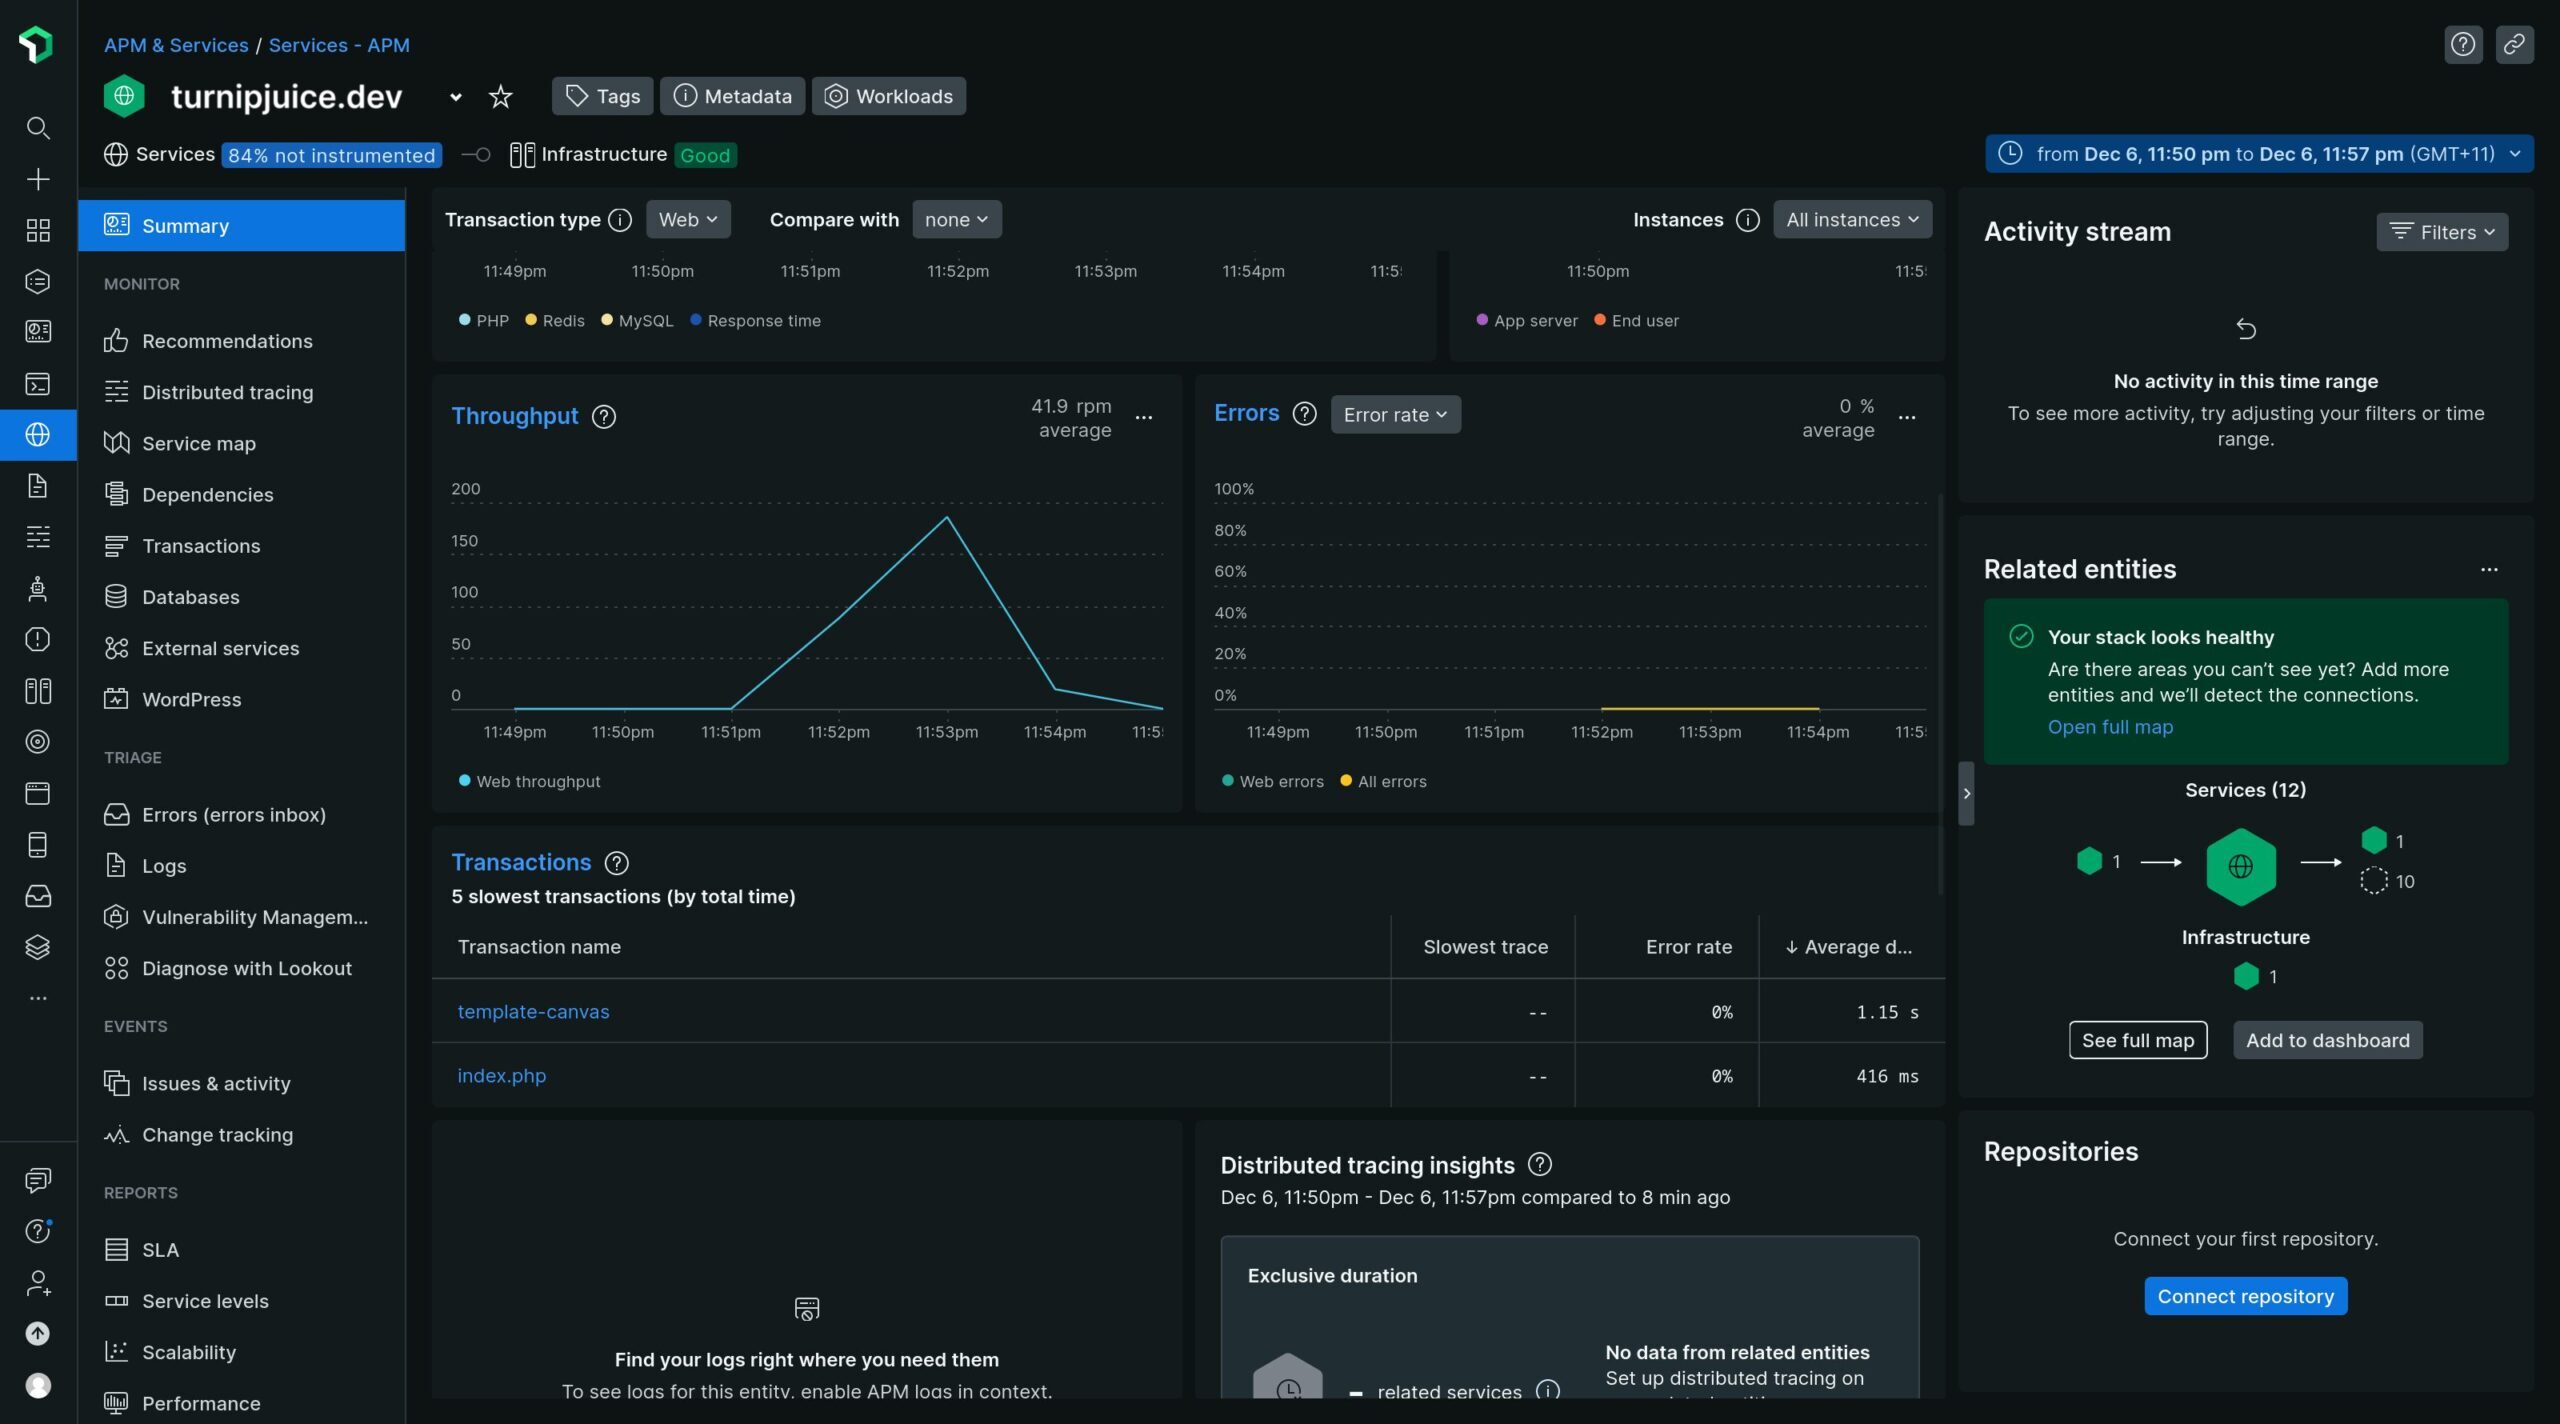
The template-canvas transaction seems slow and is worth investigating. Clicking on that transaction and scrolling down will show you a list of transaction traces you can dig into to see a detailed trace of what is happening. When you select one of these traces, New Relic will highlight the slowest components up-front:
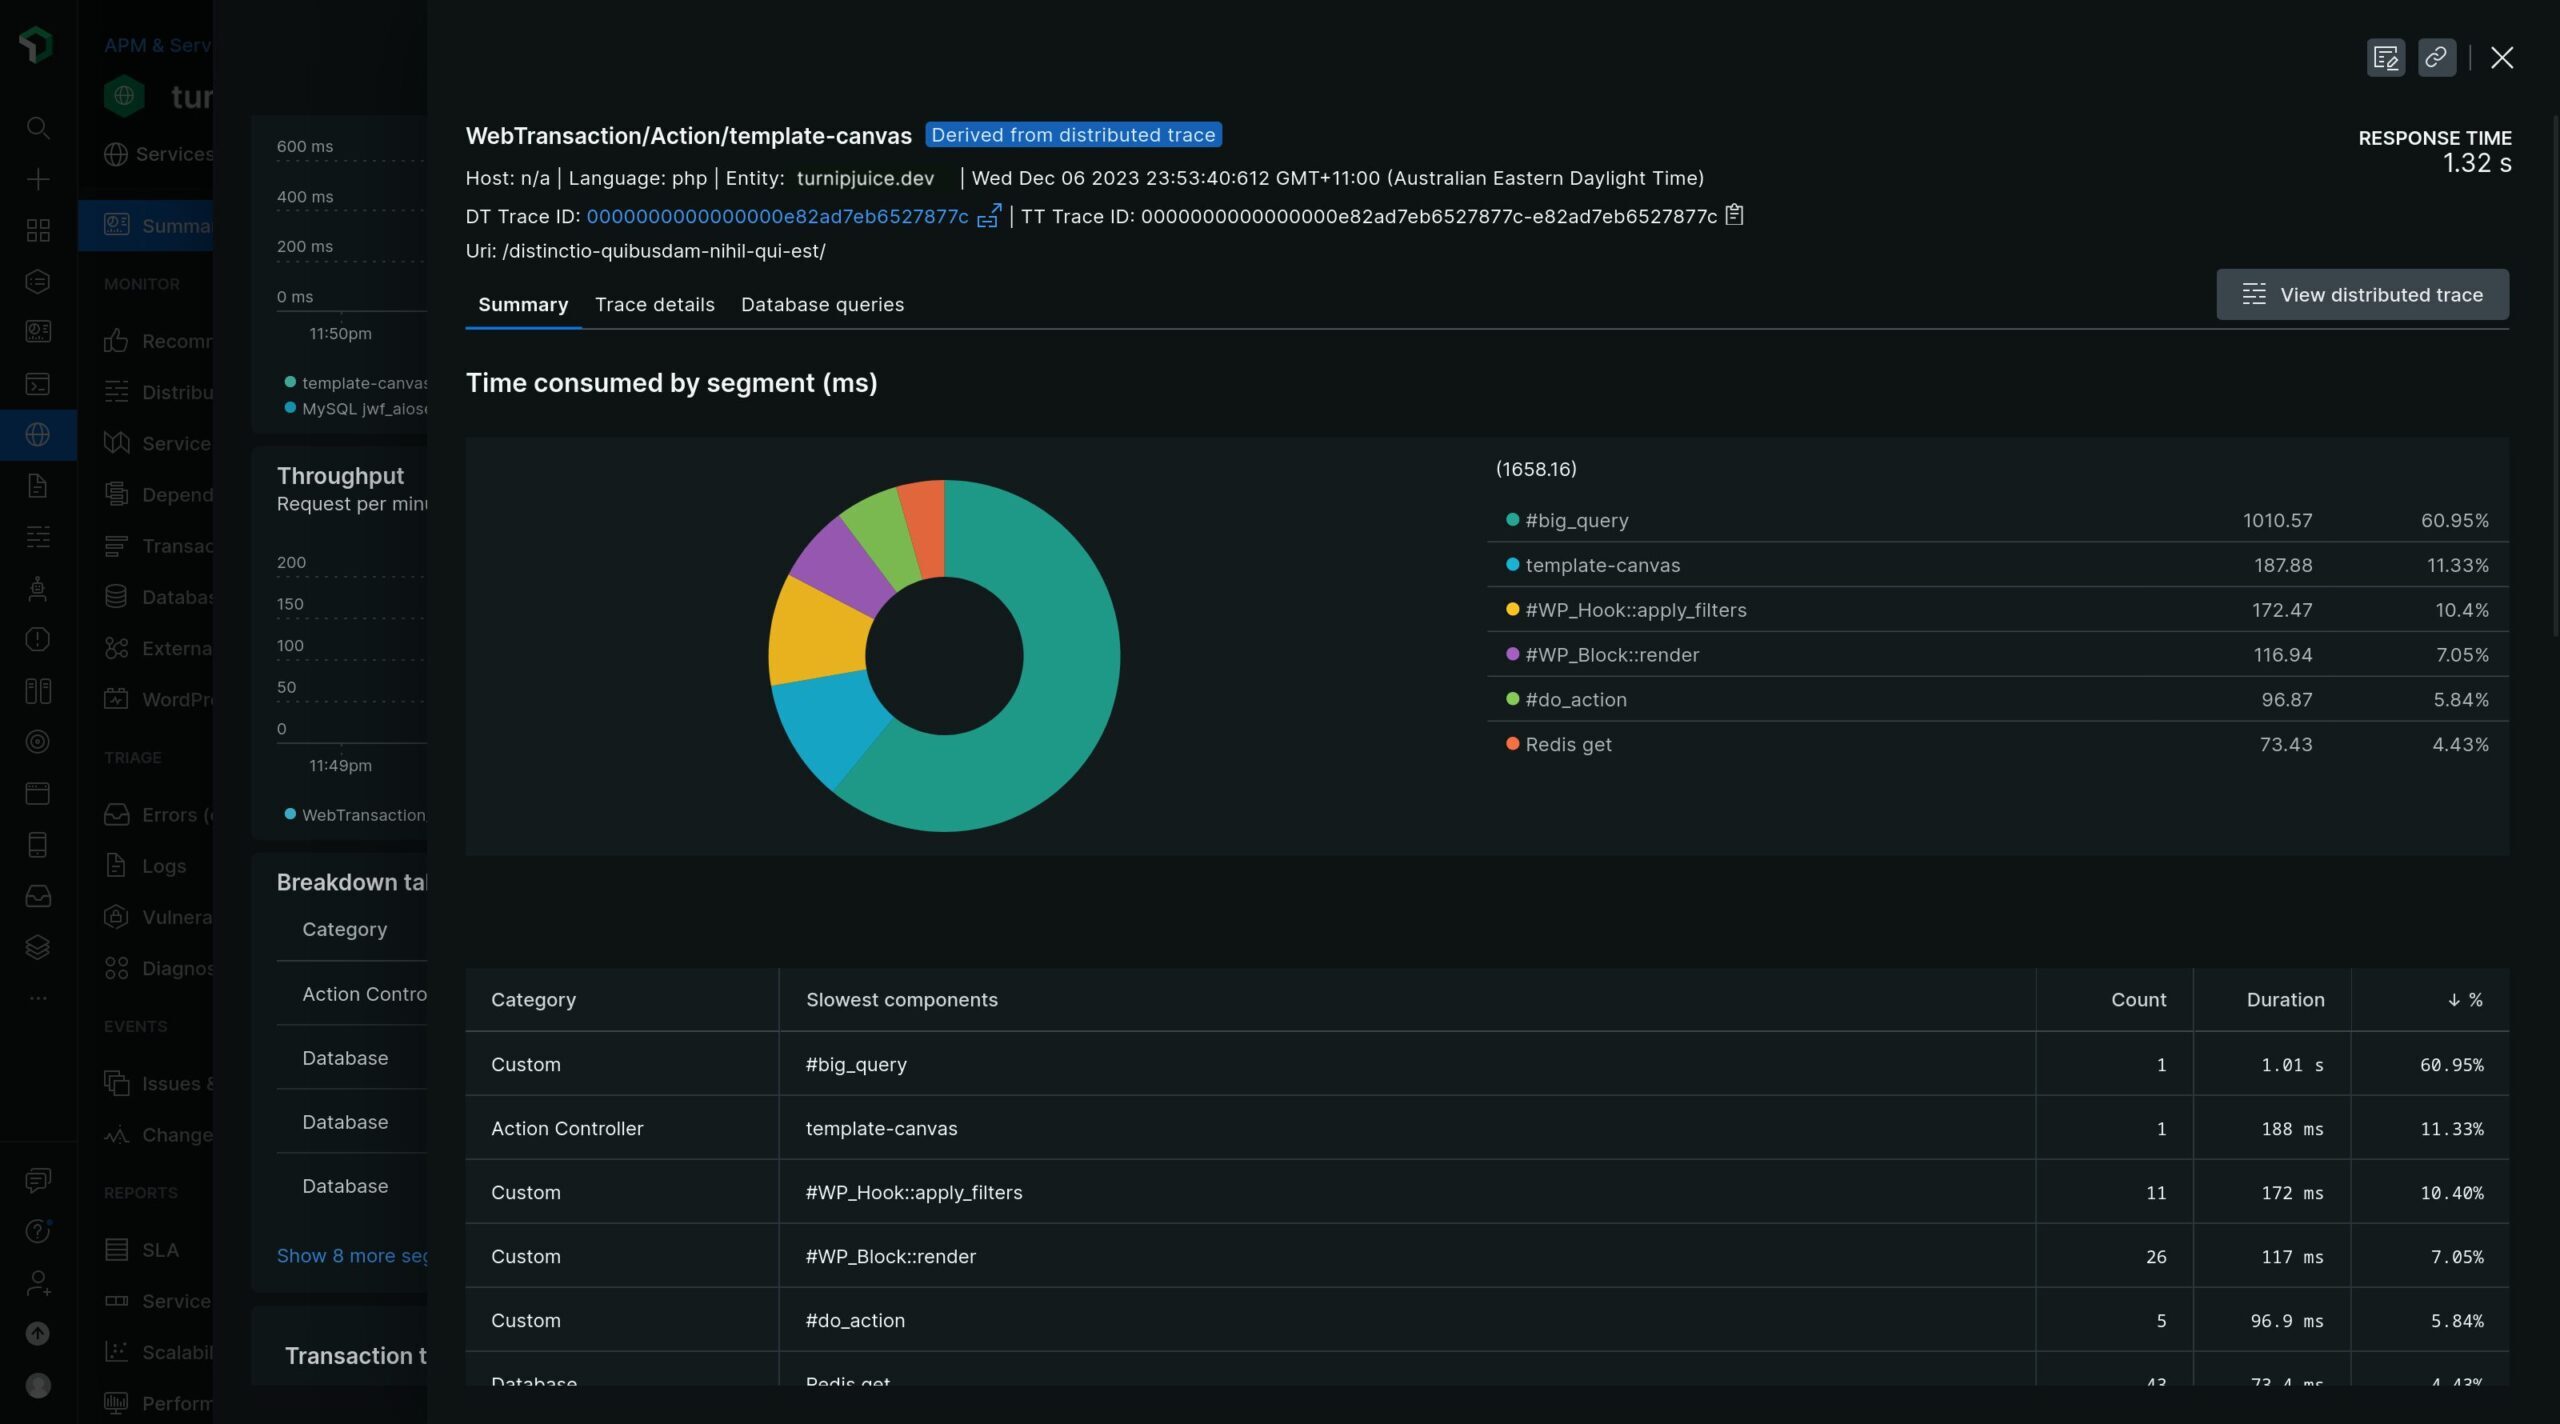
In this case, 1s is spent on a function called big_query. Switching to the Trace details tab, you can explore the trace in-depth. Searching through it, big_query can be seen as a function invoked via a short code coming from an HTML block template:
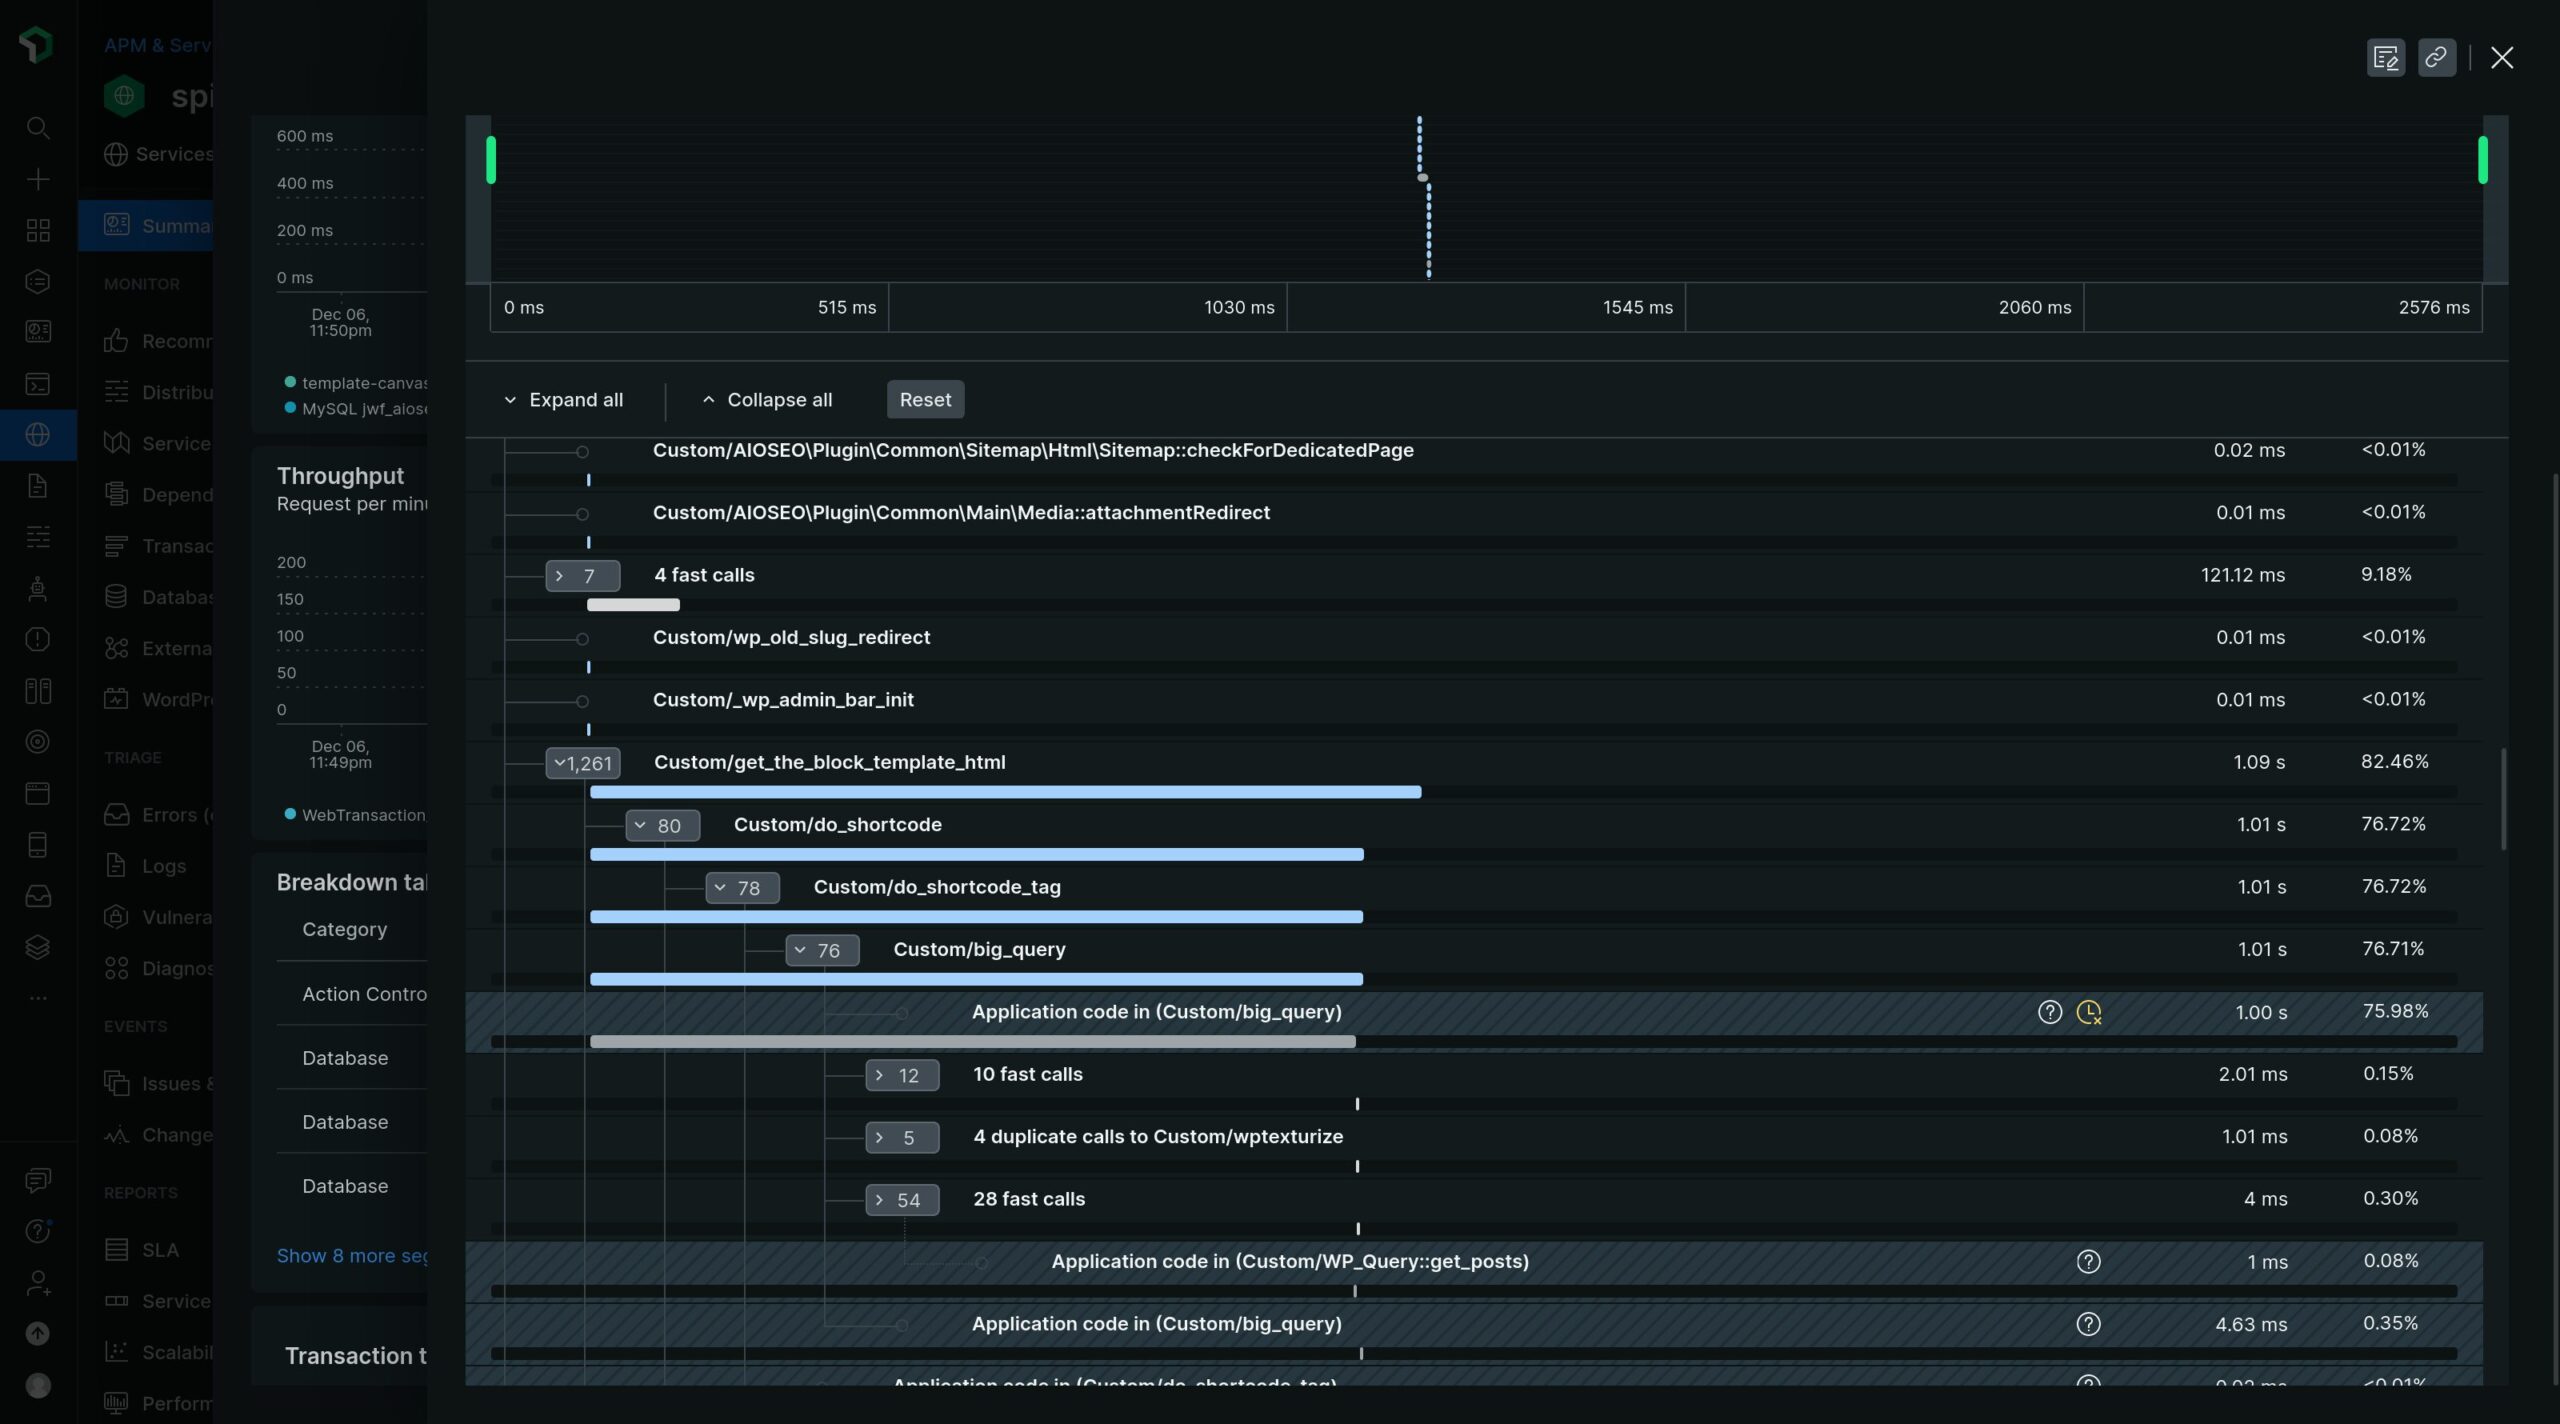
This function call accounts for 75% of the total duration of this transaction. As this is a custom function, the solution, in this case, would be to look at this custom shortcode function and optimize the code to be more performant.
Investigating Plugins
If you suspect a recently installed plugin has impacted your site’s performance, the WordPress plugins and themes screen is tailored for this specific use case. If you navigate to the WordPress tab in the left-hand menu and select the Plugins and themes page, you will see a breakdown of the top 20 plugins on your site, in terms of which are the most time-consuming:
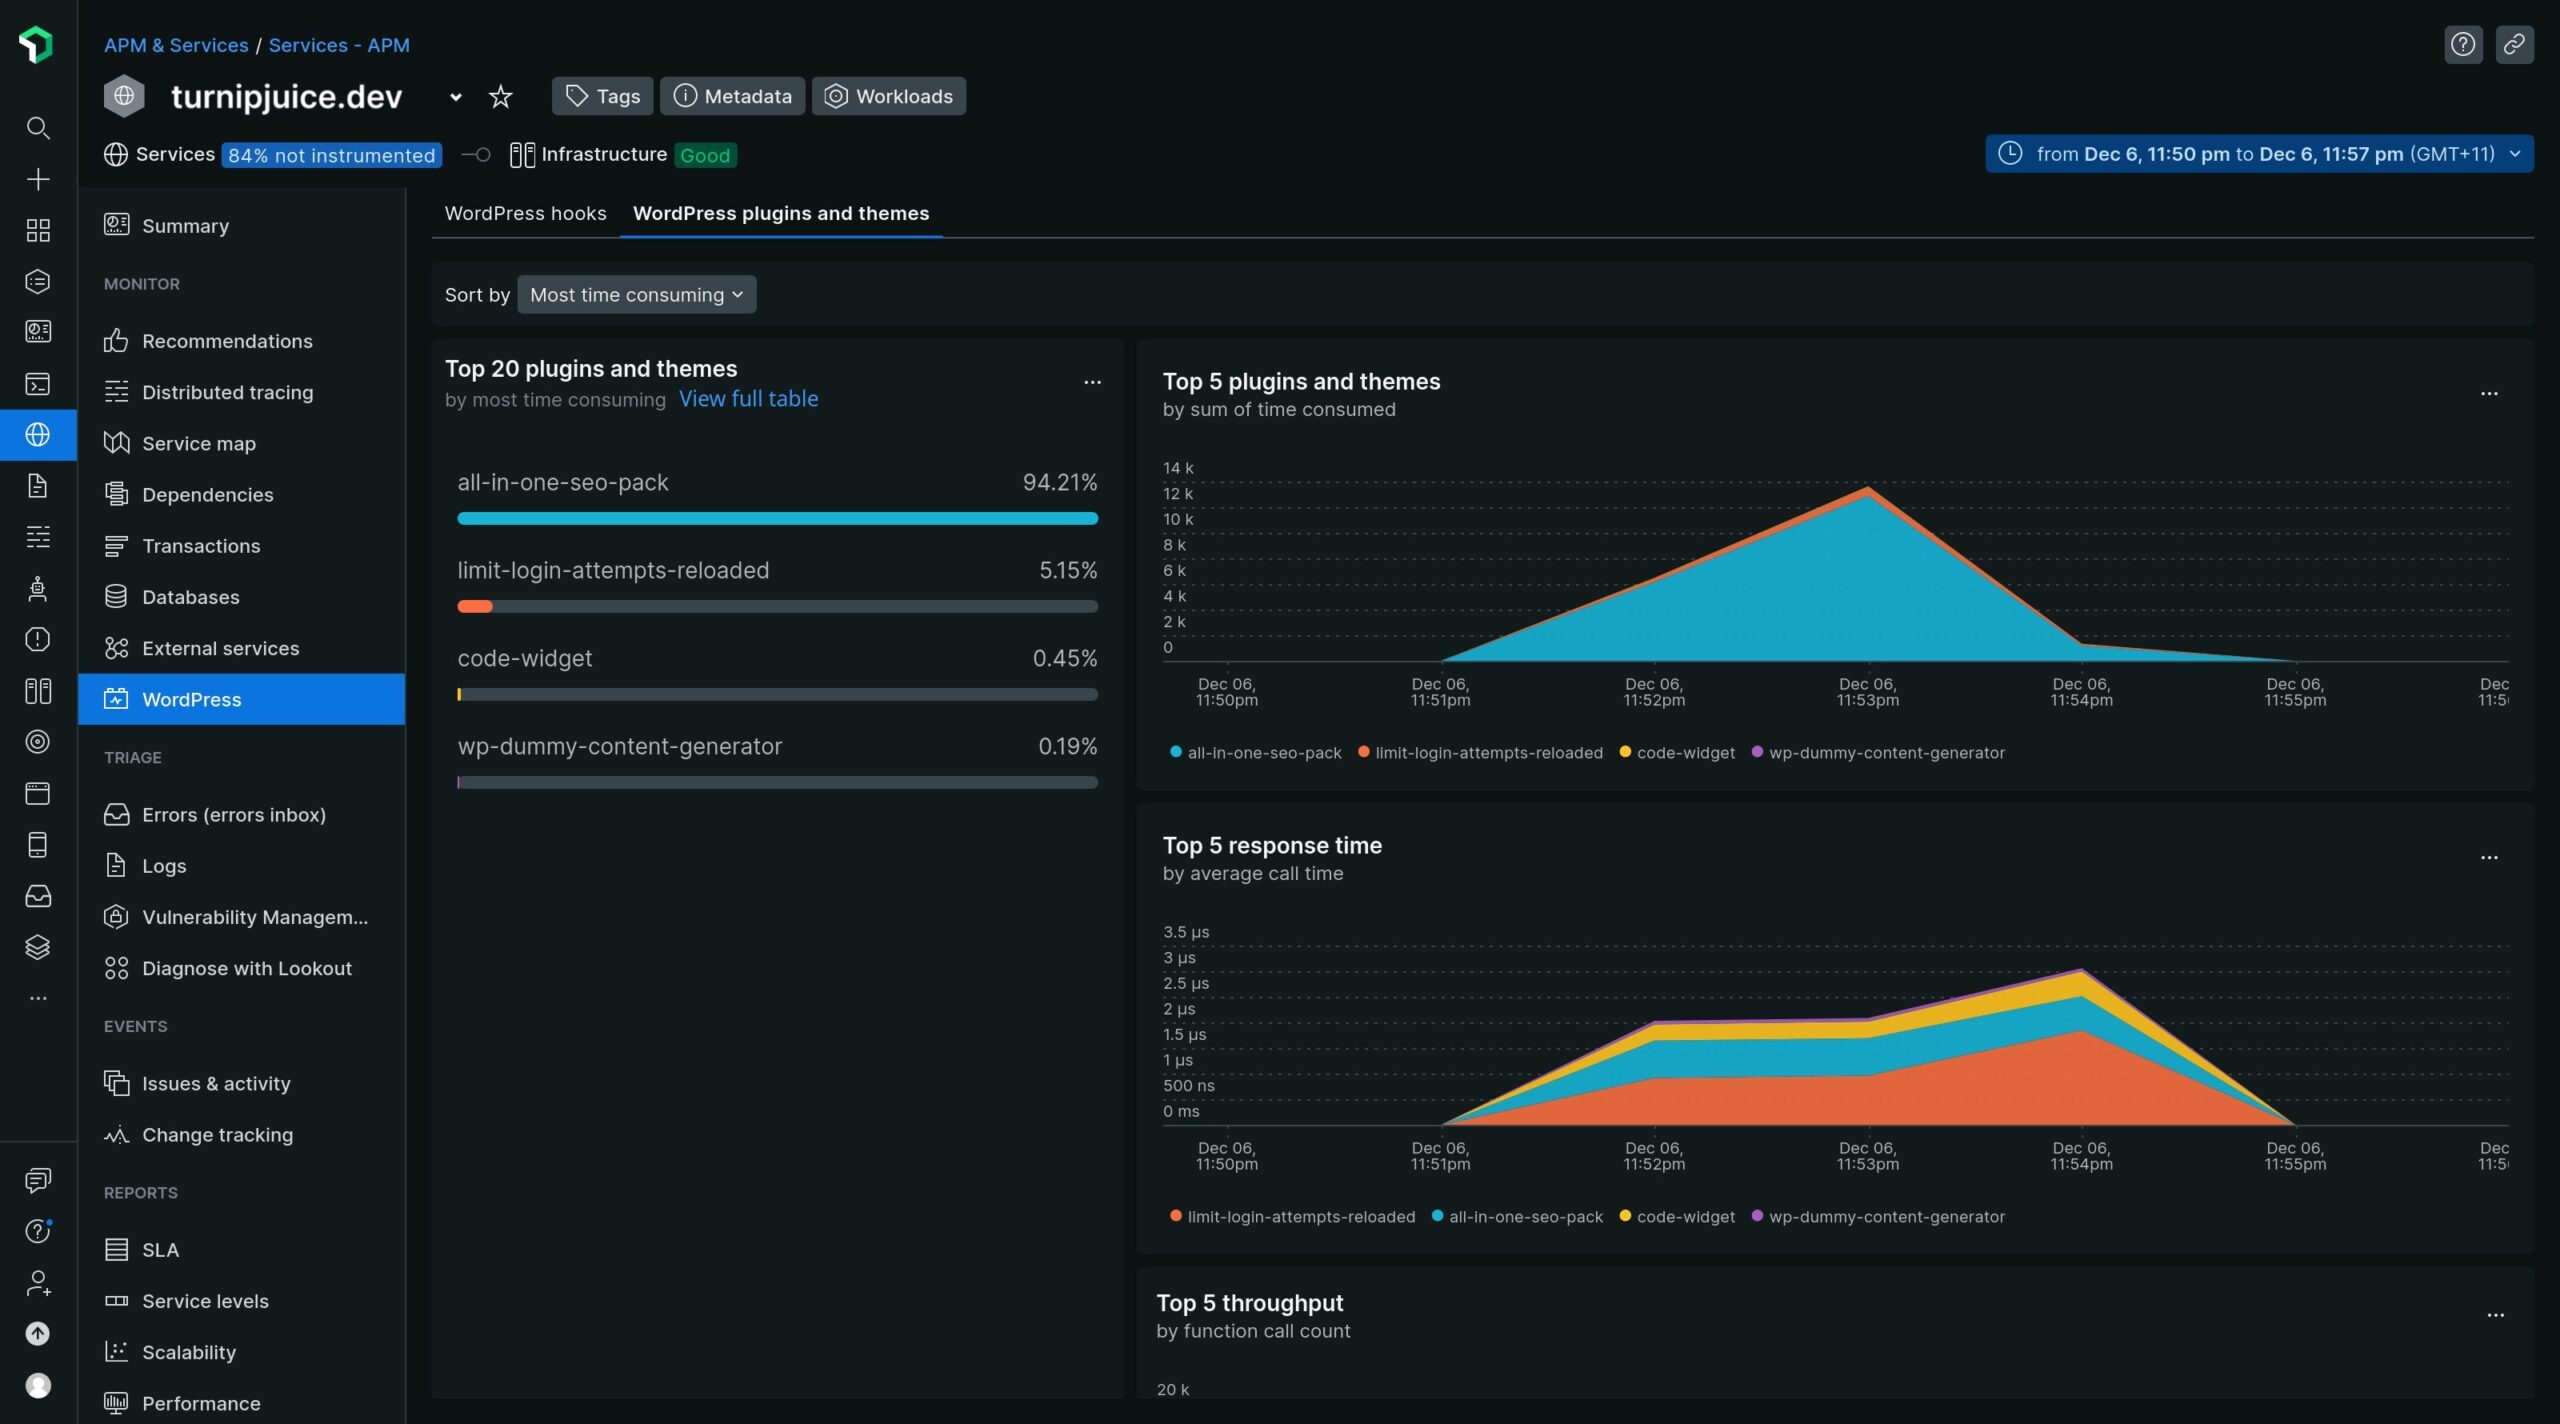
In this case, a recently installed plugin – “all-in-one-seo-pack” – dwarfs the other plugins on the list in terms of time consumed. Note that this isn’t necessarily a bad thing, as some plugins use more resources than others. However, if any of your plugins are having an impact on performance, you can tell at a glance through this screen and then decide whether the value you get from the plugin is worth the performance impact.
While New Relic is an excellent tool for investigating emergent performance issues, it can also be leveraged more proactively.
Alerting
When you initially set up the WordPress integration, New Relic configures four alerts. These can be seen by navigating to Alerts & AI in the left-hand menu:
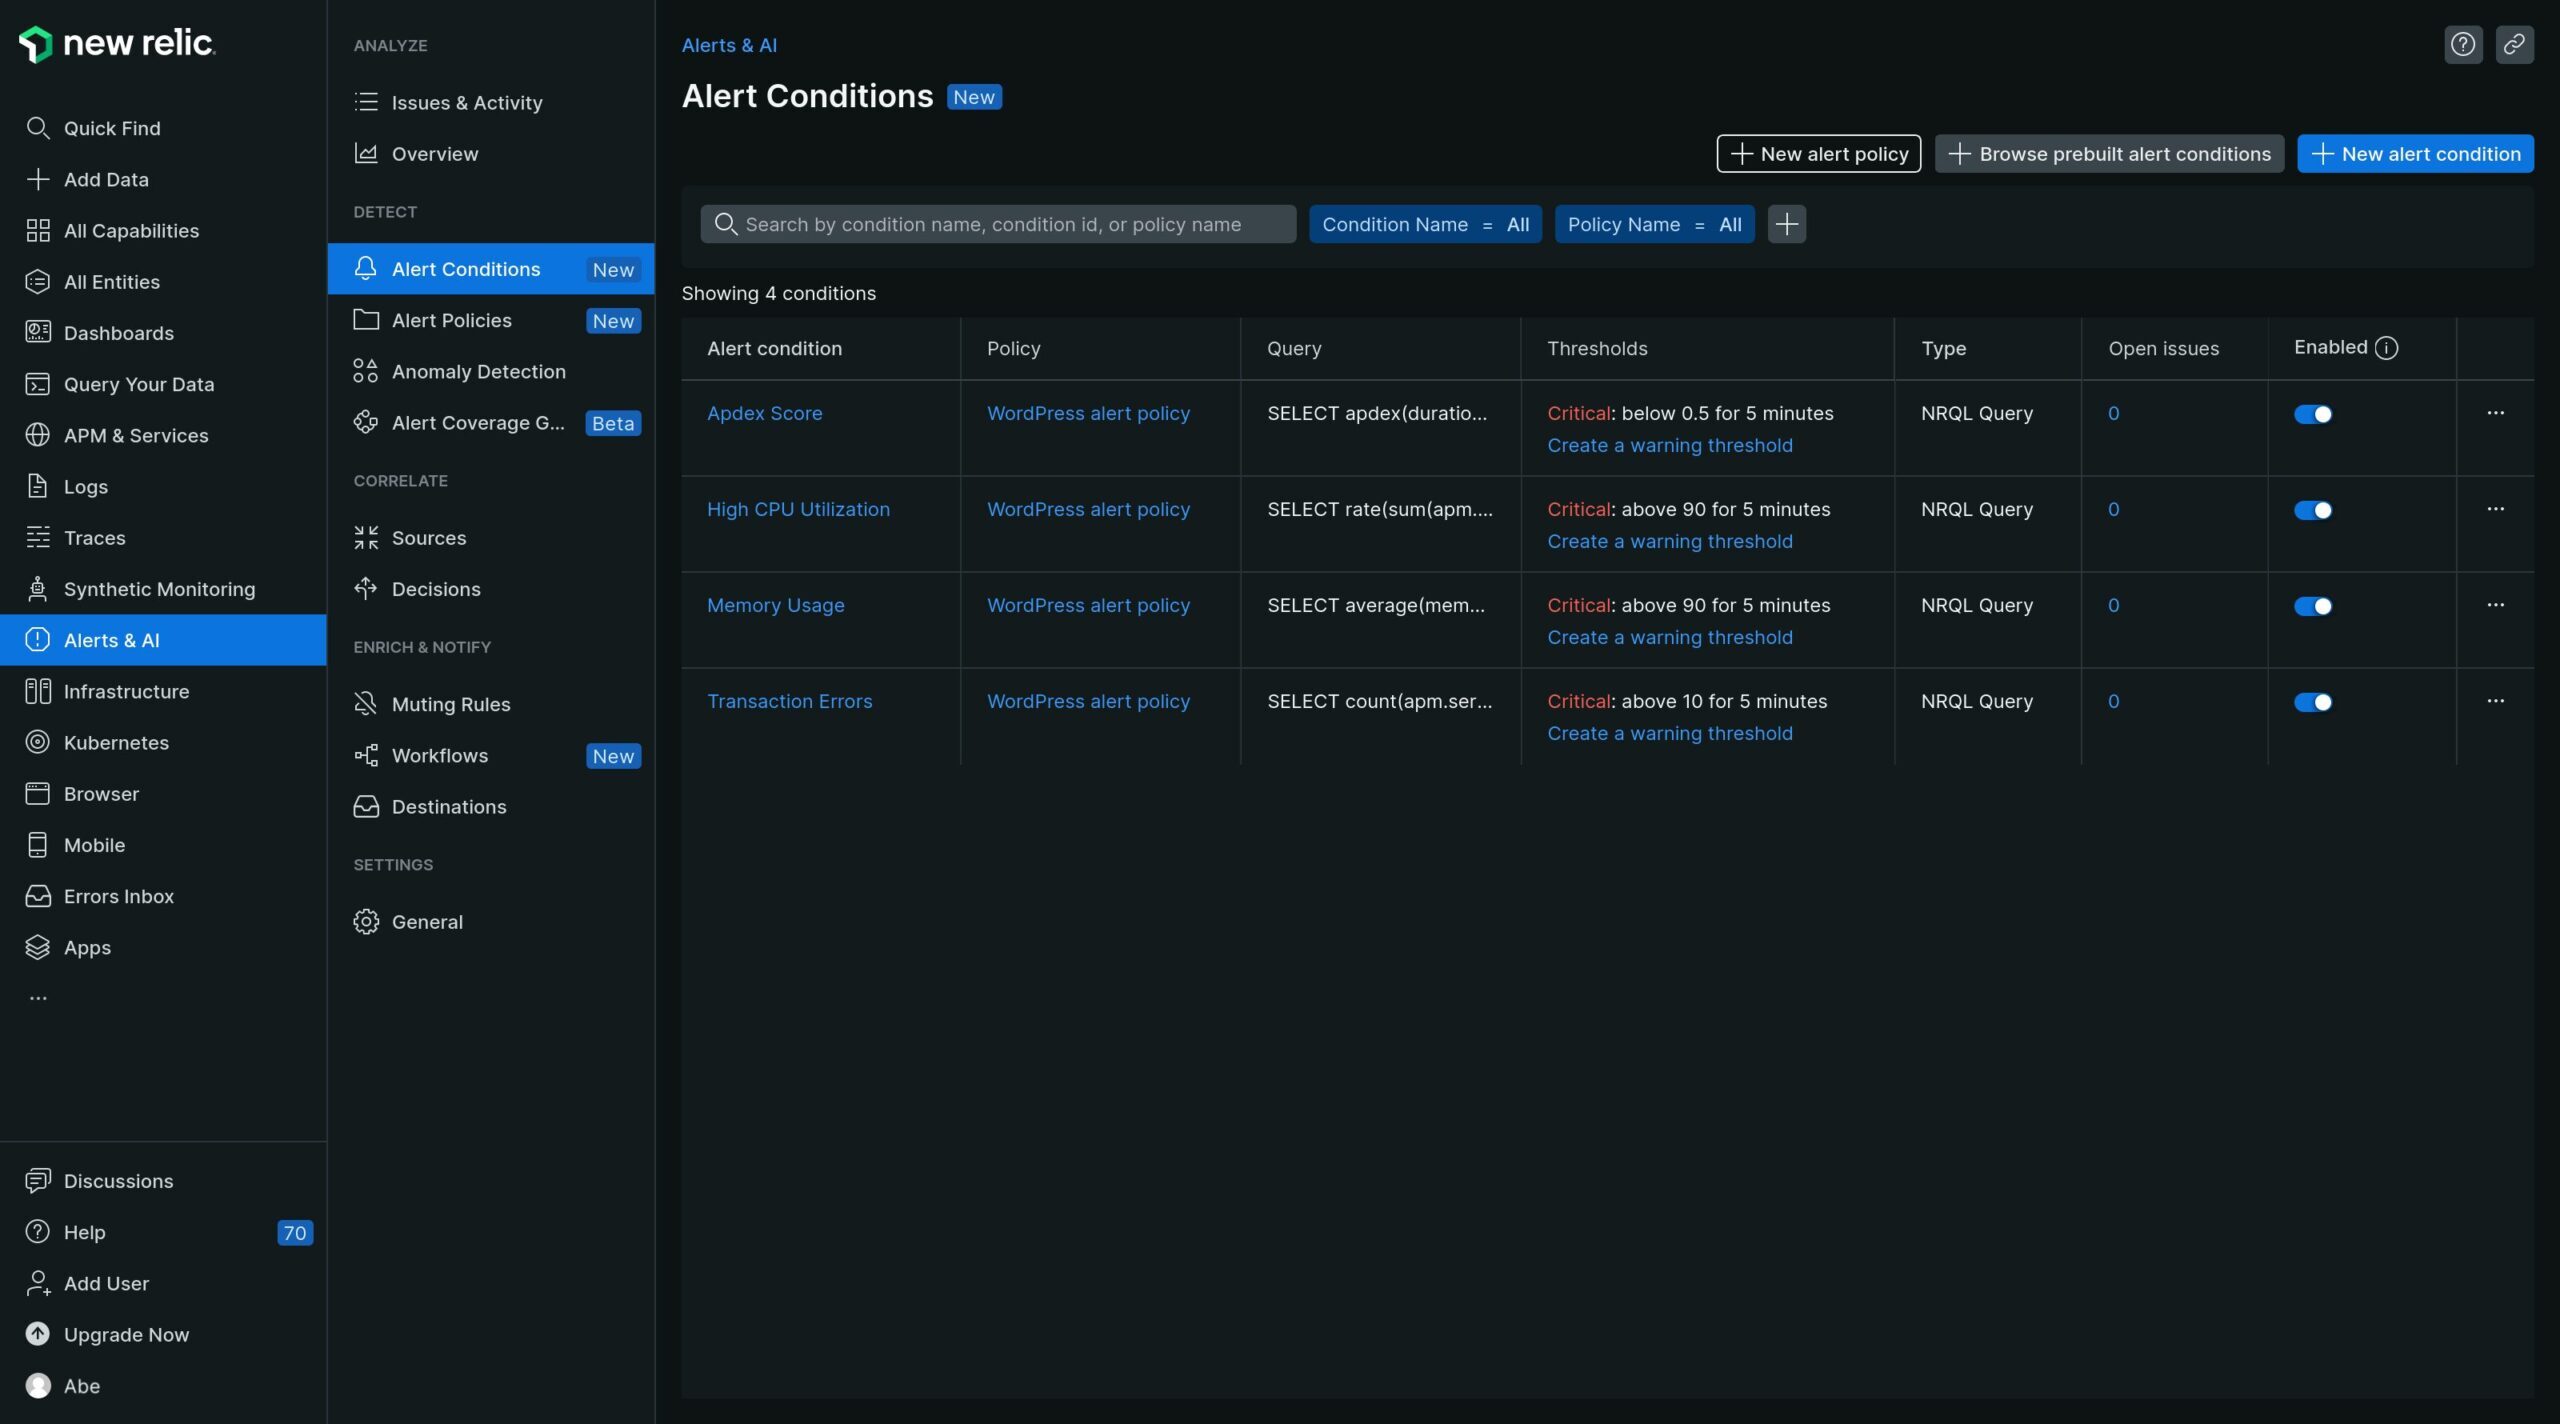
The default alerts cover common signals such as CPU and memory utilization, as well as error rates, and Apdex score. However, alerts aren’t much use if you have to log in to see when they are triggered. As such, New Relic allows you to configure destinations that can receive these alerts when they are triggered. You can do this from the Destinations tab in the sidebar. A common use case for this might be to send alerts to Slack, Email, or a custom webhook. By doing this, you can be sure that if New Relic detects any abnormal activity, you will be notified in real-time and can jump into debugging the issue.
Wrapping Up
In this article, you’ve been introduced to New Relic, an APM and observability platform that works with various systems, including WordPress. You’ve seen how to set New Relic up with an existing WordPress site, as well as a high-level overview of the different features and functionality available to you and how you can start using them to debug performance issues and slowdowns on your site. New Relic packs a lot of functionality, and the volume of data presented can be overwhelming at first. However, it is hard to beat if you are after a holistic snapshot of everything about your site’s performance.
Have you used New Relic before? If so, how was your experience? Do you use another tool for performance monitoring? Let us know in the comments below.
